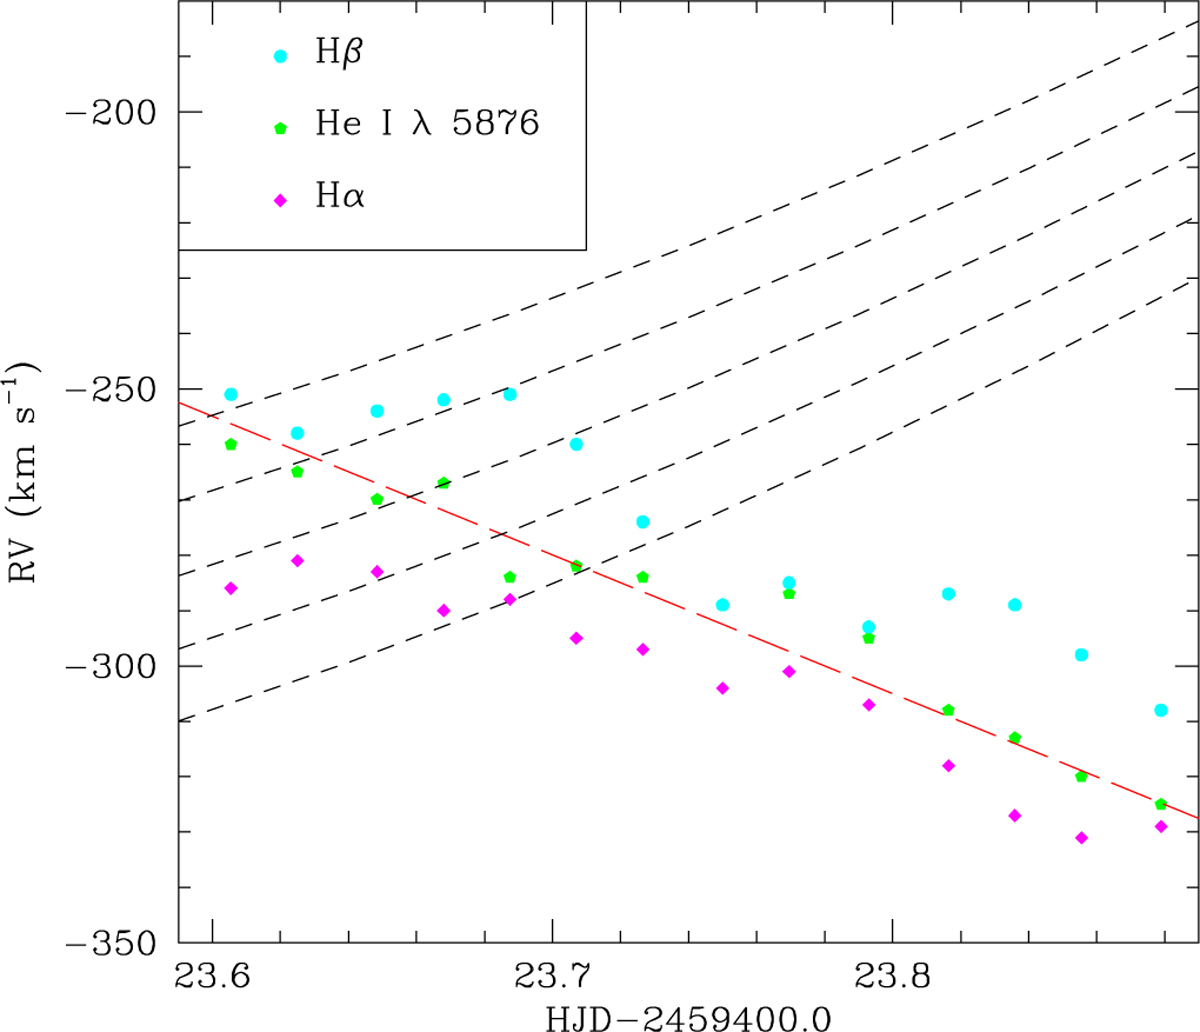
Fig. 7
Download original image
RVs of discrete absorption in three spectral lines of HD 192639 during the rising part of the trough event. Different symbols stand for different lines as shown by the insert. The red long-dashed line corresponds to a bluewards acceleration of 3 m s–2. The short-dashed lines correspond to the predictions from Eq. (6) for line-formation regions between 1.17 and 1.21 R*.
Current usage metrics show cumulative count of Article Views (full-text article views including HTML views, PDF and ePub downloads, according to the available data) and Abstracts Views on Vision4Press platform.
Data correspond to usage on the plateform after 2015. The current usage metrics is available 48-96 hours after online publication and is updated daily on week days.
Initial download of the metrics may take a while.