Fig. 8
Download original image
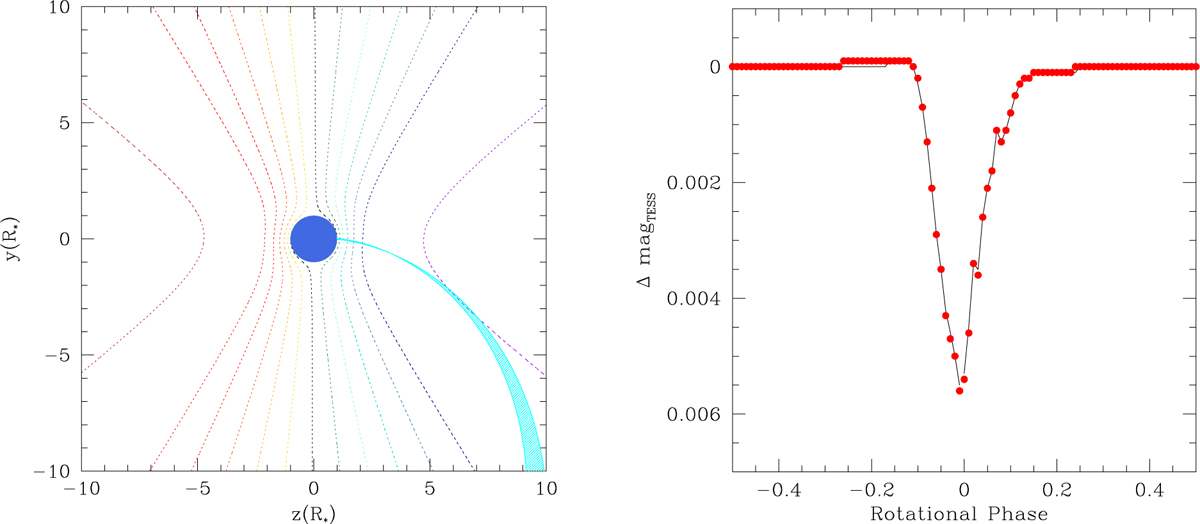
Left: schematic representation of the CIR in the equatorial plane for our default model (see Table 5) at rotational phase 0.0. The observer is located at z → ∞ and y = 0. The star rotates anti-clockwise. The dotted coloured contours represent iso-radial velocity surfaces with values of 1500, 1000, 800, 600, 400, 200, 0, –200, –400, –600, –800, –1000, and –1500 km s–1 (from left to right). Right: predicted light curve due to electron scattering by the co-rotating CIR with our default model. The black curve yields the results for a Power-2 limb-darkening relation, whilst the red dots correspond to a linear limb darkening.
Current usage metrics show cumulative count of Article Views (full-text article views including HTML views, PDF and ePub downloads, according to the available data) and Abstracts Views on Vision4Press platform.
Data correspond to usage on the plateform after 2015. The current usage metrics is available 48-96 hours after online publication and is updated daily on week days.
Initial download of the metrics may take a while.