Fig. 1
Download original image
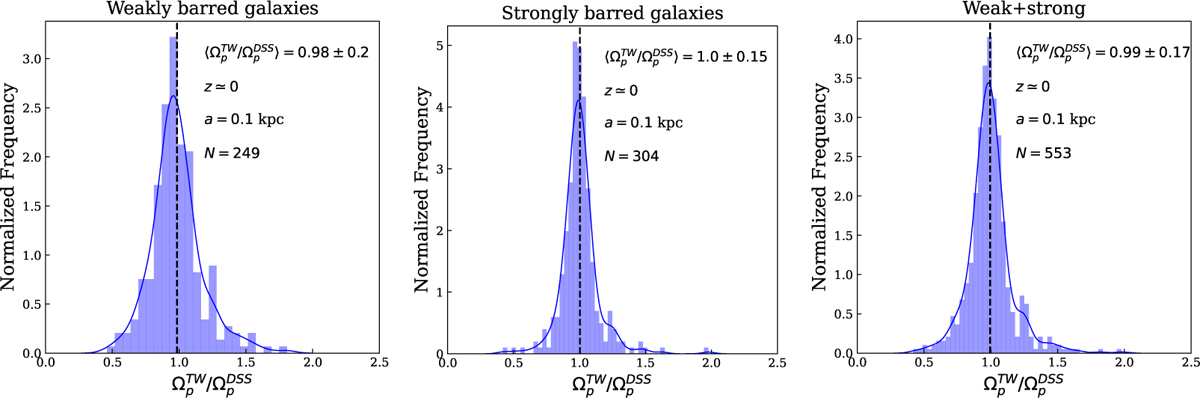
Distribution of the ratio ![]() (blue histogram) for the weak (left panel) and strong bars (central panel) as well as for both of them (right panel). Each panel reports the mean value (dashed vertical line), of this ratio with its corresponding error, calculated as the standard deviation around the mean, ɀ is the redshift, a is the spatial sampling, and Ν is the number of the galaxies. The blue curves in each panel represent continuous probability density functions derived from the data.
(blue histogram) for the weak (left panel) and strong bars (central panel) as well as for both of them (right panel). Each panel reports the mean value (dashed vertical line), of this ratio with its corresponding error, calculated as the standard deviation around the mean, ɀ is the redshift, a is the spatial sampling, and Ν is the number of the galaxies. The blue curves in each panel represent continuous probability density functions derived from the data.
Current usage metrics show cumulative count of Article Views (full-text article views including HTML views, PDF and ePub downloads, according to the available data) and Abstracts Views on Vision4Press platform.
Data correspond to usage on the plateform after 2015. The current usage metrics is available 48-96 hours after online publication and is updated daily on week days.
Initial download of the metrics may take a while.