Open Access
Fig. B.1
Download original image
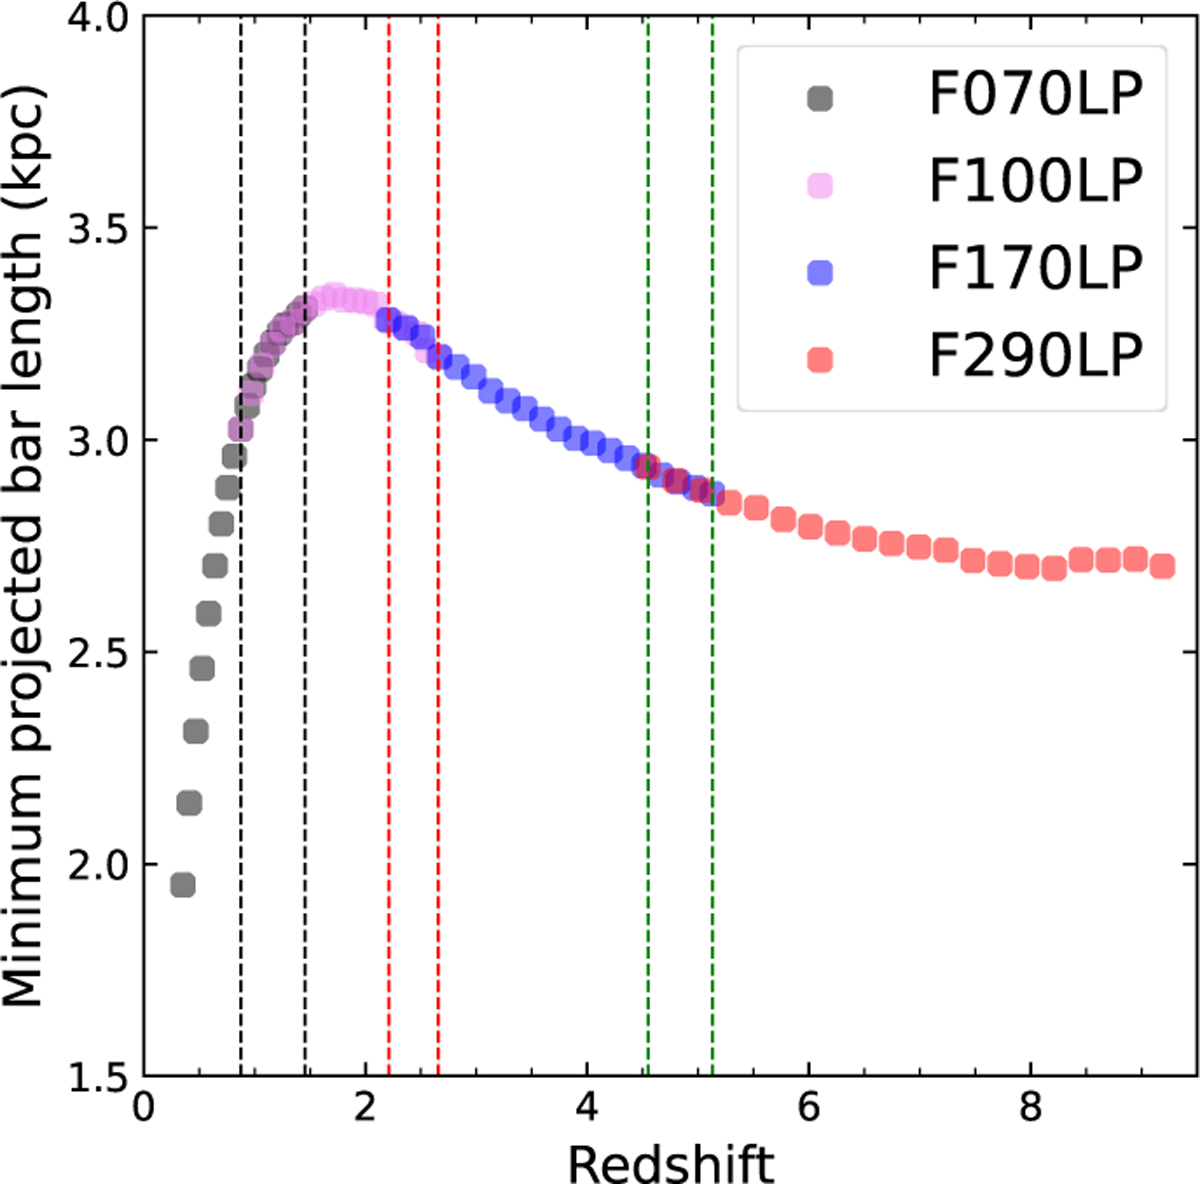
Minimum projected bar length, ![]() , required for the TW method as a function of redshift. The vertical lines indicate the redshift ranges where two successive filters overlap. As indicated in the legends, the different colors on the main curve, represent different filters.
, required for the TW method as a function of redshift. The vertical lines indicate the redshift ranges where two successive filters overlap. As indicated in the legends, the different colors on the main curve, represent different filters.
Current usage metrics show cumulative count of Article Views (full-text article views including HTML views, PDF and ePub downloads, according to the available data) and Abstracts Views on Vision4Press platform.
Data correspond to usage on the plateform after 2015. The current usage metrics is available 48-96 hours after online publication and is updated daily on week days.
Initial download of the metrics may take a while.