Fig. 3
Download original image
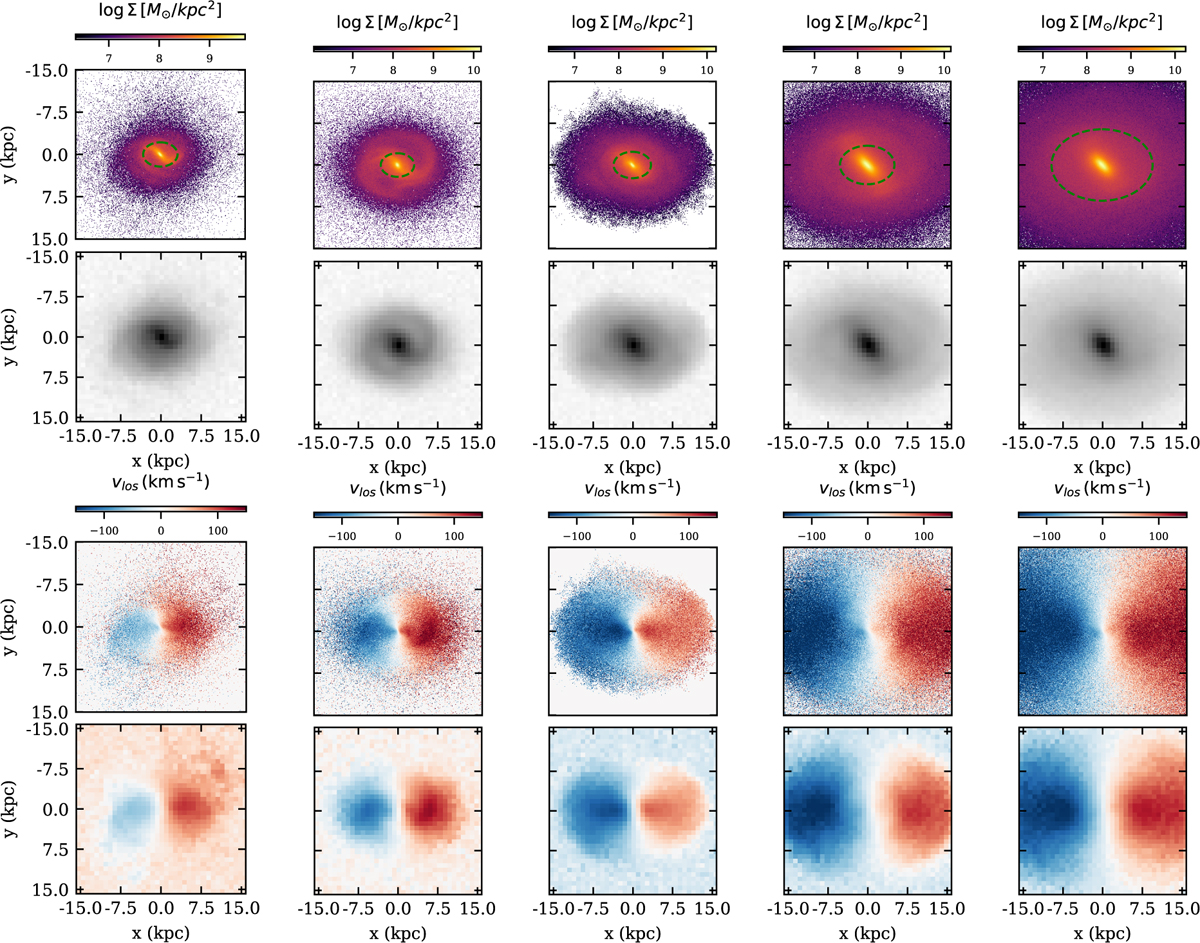
Mass surface density and velocity maps for Ave TNG50 galaxies.The first row illustrates the original mass surface density of these galaxies. The second row presents their corresponding mock observations. The third row shows the original line-of-sight velocity maps, while the fourth row displays their final mock observational representations. The green ellipses in the top row indicate the half-mass radii of the galaxies.
Current usage metrics show cumulative count of Article Views (full-text article views including HTML views, PDF and ePub downloads, according to the available data) and Abstracts Views on Vision4Press platform.
Data correspond to usage on the plateform after 2015. The current usage metrics is available 48-96 hours after online publication and is updated daily on week days.
Initial download of the metrics may take a while.