Fig. 8
Download original image
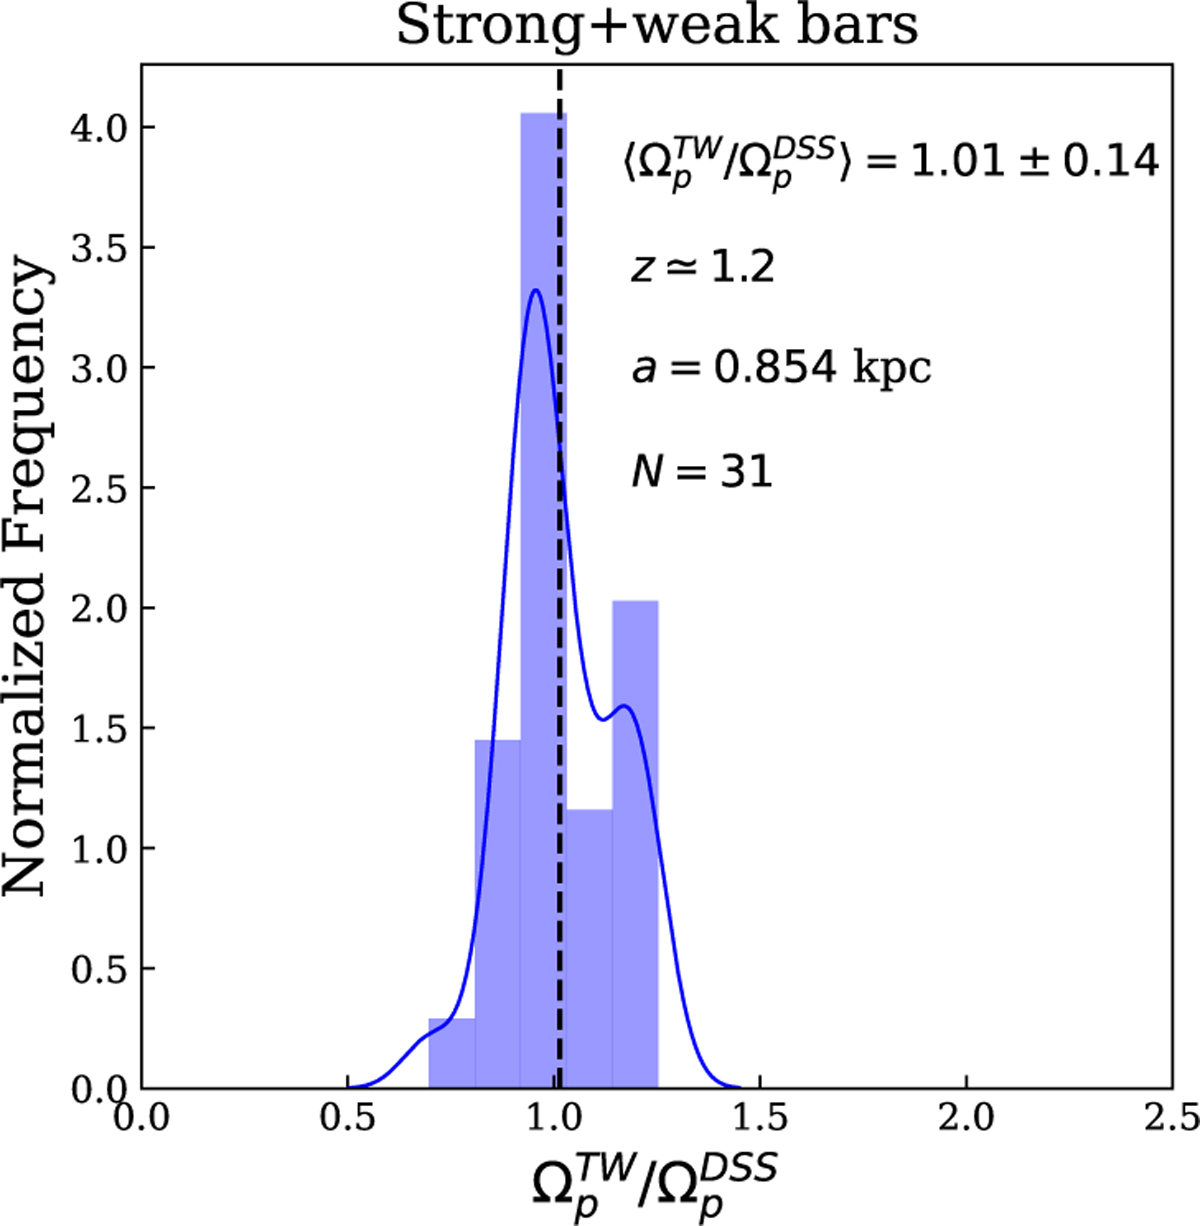
Distribution of the ratio ![]() (blue histogram) for 31 galaxies (comprising weak and strong bars) that are sufficiently extended to be detected by the TW method at ɀ ≃ 1.2. The bar PA and the inclination of the disks have been measured using the isophotal analysis. The blue curve represents the continuous probability density functions derived from the data.
(blue histogram) for 31 galaxies (comprising weak and strong bars) that are sufficiently extended to be detected by the TW method at ɀ ≃ 1.2. The bar PA and the inclination of the disks have been measured using the isophotal analysis. The blue curve represents the continuous probability density functions derived from the data.
Current usage metrics show cumulative count of Article Views (full-text article views including HTML views, PDF and ePub downloads, according to the available data) and Abstracts Views on Vision4Press platform.
Data correspond to usage on the plateform after 2015. The current usage metrics is available 48-96 hours after online publication and is updated daily on week days.
Initial download of the metrics may take a while.