Fig. 1.
Download original image
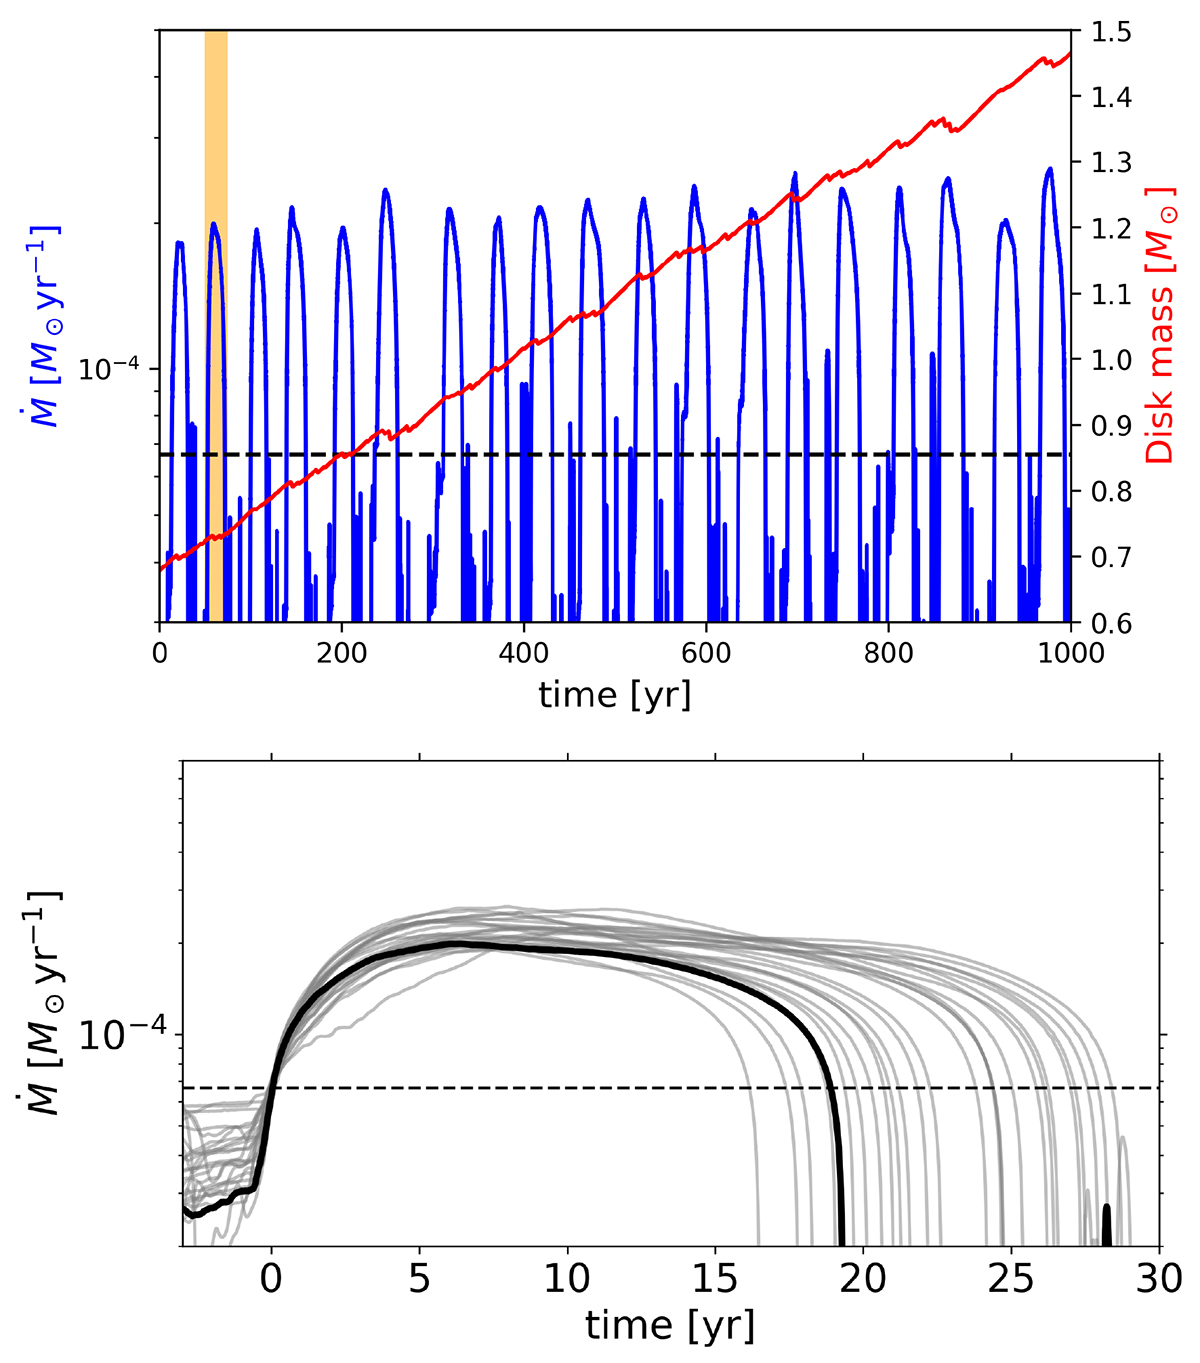
Mass accretion history and TI outbursts in our fiducial model TI_1. Top panel: The blue line (left axis) shows the mass accretion rate, while the red line (right axis) displays the protostellar disk mass over 1000 years of stellar evolution, revealing the periodic occurrence of TI outbursts. The time origin, t = 0, is chosen arbitrarily. Bottom panel: Detailed view of a single TI outburst (highlighted in orange in the top panel), shown with a thick black line, along with subsequent outbursts in the same model (gray lines). Here, t = 0 is defined as the moment when the accretion rate exceeds the threshold Ṁth (indicated by the horizontal dashed line in both panels).
Current usage metrics show cumulative count of Article Views (full-text article views including HTML views, PDF and ePub downloads, according to the available data) and Abstracts Views on Vision4Press platform.
Data correspond to usage on the plateform after 2015. The current usage metrics is available 48-96 hours after online publication and is updated daily on week days.
Initial download of the metrics may take a while.