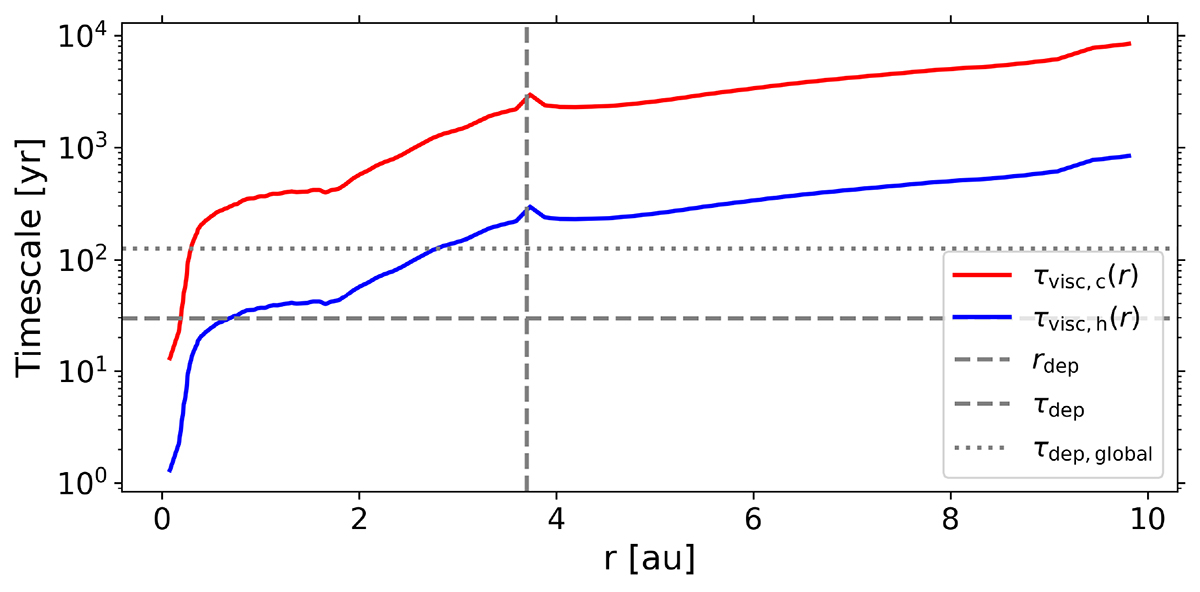
Fig. B.2.
Download original image
Radial profiles of characteristic timescales in the disk. The red and blue curves show the time-averaged viscous timescales for α = αc = 0.05 and α = αh = 0.5 disk regions, respectively. The horizontal dashed line marks the mean mass-deposition timescale τdep at the characteristic deposition radius rdep (vertical dashed line). The horizontal dotted line marks the global mass-deposition timescale, τdep, global=![]() yr.
yr.
Current usage metrics show cumulative count of Article Views (full-text article views including HTML views, PDF and ePub downloads, according to the available data) and Abstracts Views on Vision4Press platform.
Data correspond to usage on the plateform after 2015. The current usage metrics is available 48-96 hours after online publication and is updated daily on week days.
Initial download of the metrics may take a while.