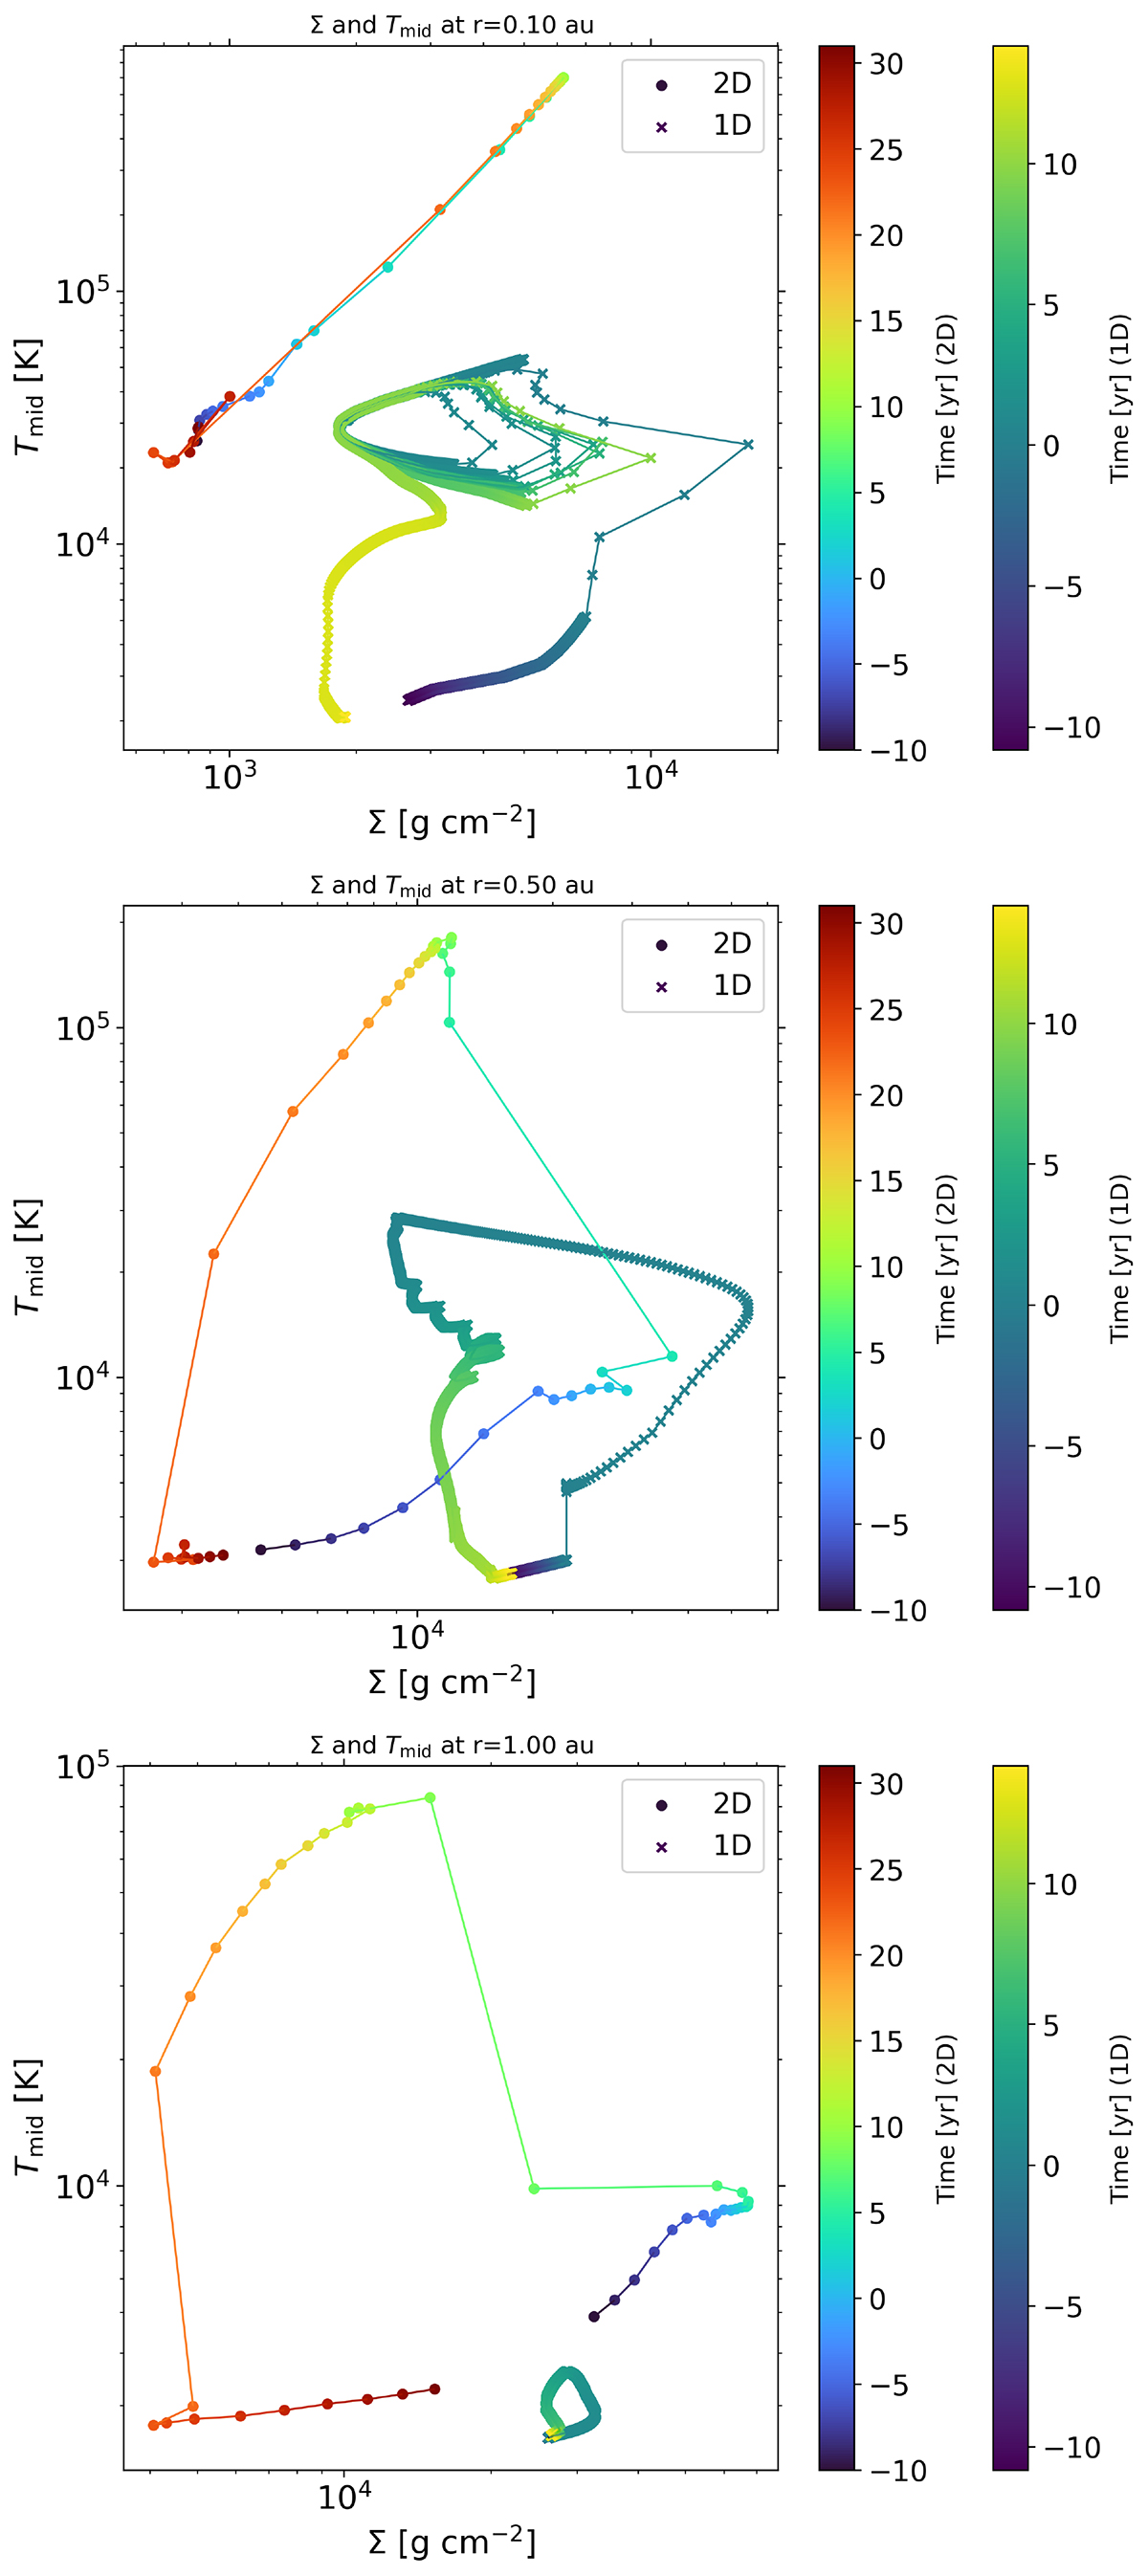
Fig. C.1.
Download original image
Time evolution of the midplane temperature Tmid versus surface density Σ at r = 0.1 au (top panel), r = 0.5 au (middle panel), and r = 1.0 au (bottom panel) for our 1D (Elbakyan et al. 2024) and 2D (this work, model TI_1) TI models. Colored points and lines show the trajectory from the 2D model. Crosses and lines show the corresponding evolution from the 1D model. Time t = 0 corresponds to the beginning of the TI burst.
Current usage metrics show cumulative count of Article Views (full-text article views including HTML views, PDF and ePub downloads, according to the available data) and Abstracts Views on Vision4Press platform.
Data correspond to usage on the plateform after 2015. The current usage metrics is available 48-96 hours after online publication and is updated daily on week days.
Initial download of the metrics may take a while.