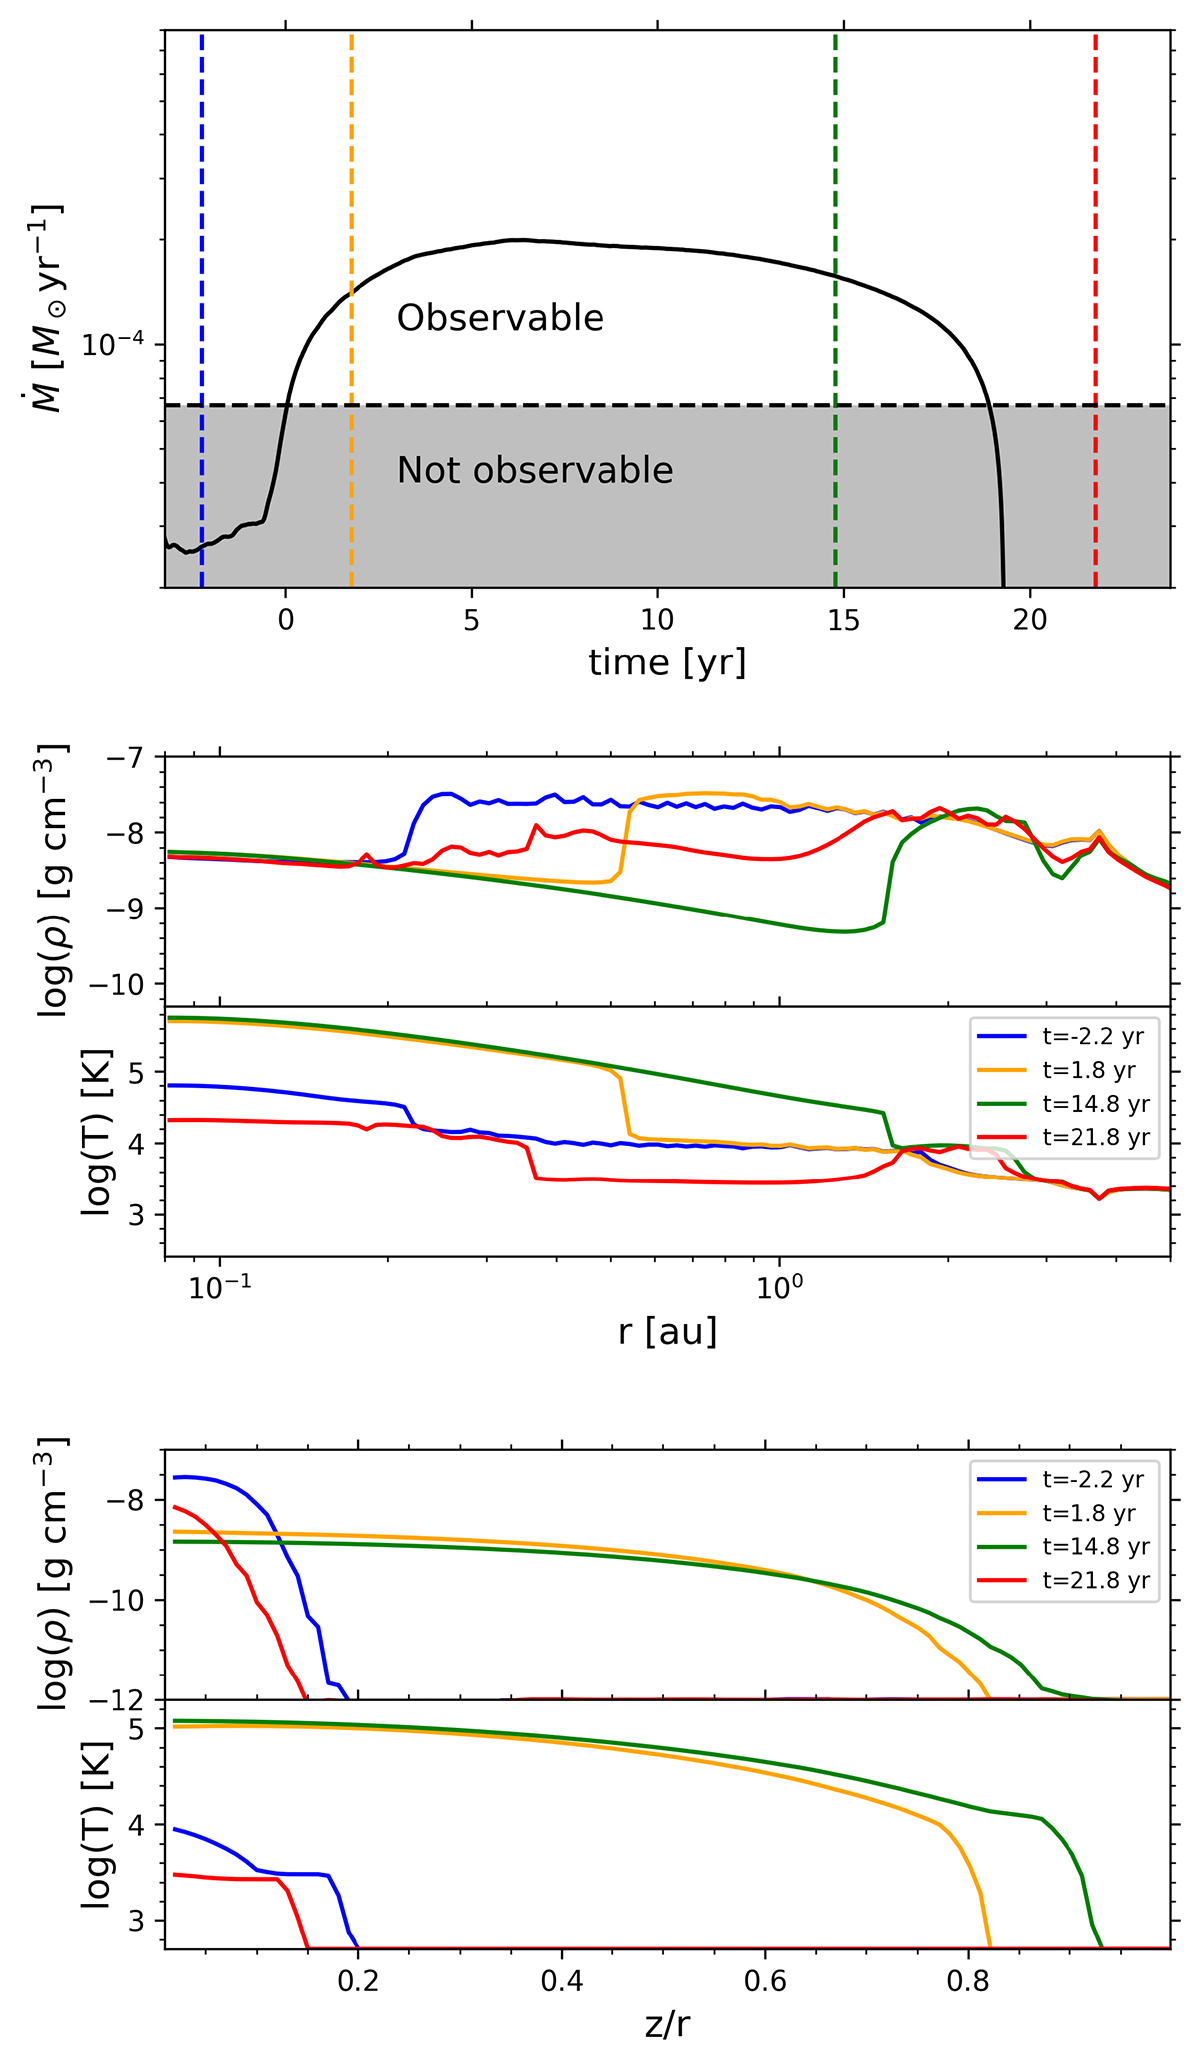
Fig. 2.
Download original image
Mass accretion rate and spatial distribution of disk density and temperature during a TI outburst. Top panel: Mass accretion rate for the TI outburst highlighted in orange in Figure 1. The gray shaded region below the threshold accretion rate, Ṁth (dashed horizontal line), indicates the range of variability that remains unobservable. Vertical dashed lines mark the time instances corresponding to the spatial distributions presented in the middle and bottom panels with the corresponding colors. Middle panel: Radial profiles of density and temperature along the disk midplane before, during, and after the burst. Bottom panel: Vertical profiles of density and temperature at a radial distance of r = 0.5 au for the same epochs, illustrating the disk’s vertical structure evolution.
Current usage metrics show cumulative count of Article Views (full-text article views including HTML views, PDF and ePub downloads, according to the available data) and Abstracts Views on Vision4Press platform.
Data correspond to usage on the plateform after 2015. The current usage metrics is available 48-96 hours after online publication and is updated daily on week days.
Initial download of the metrics may take a while.