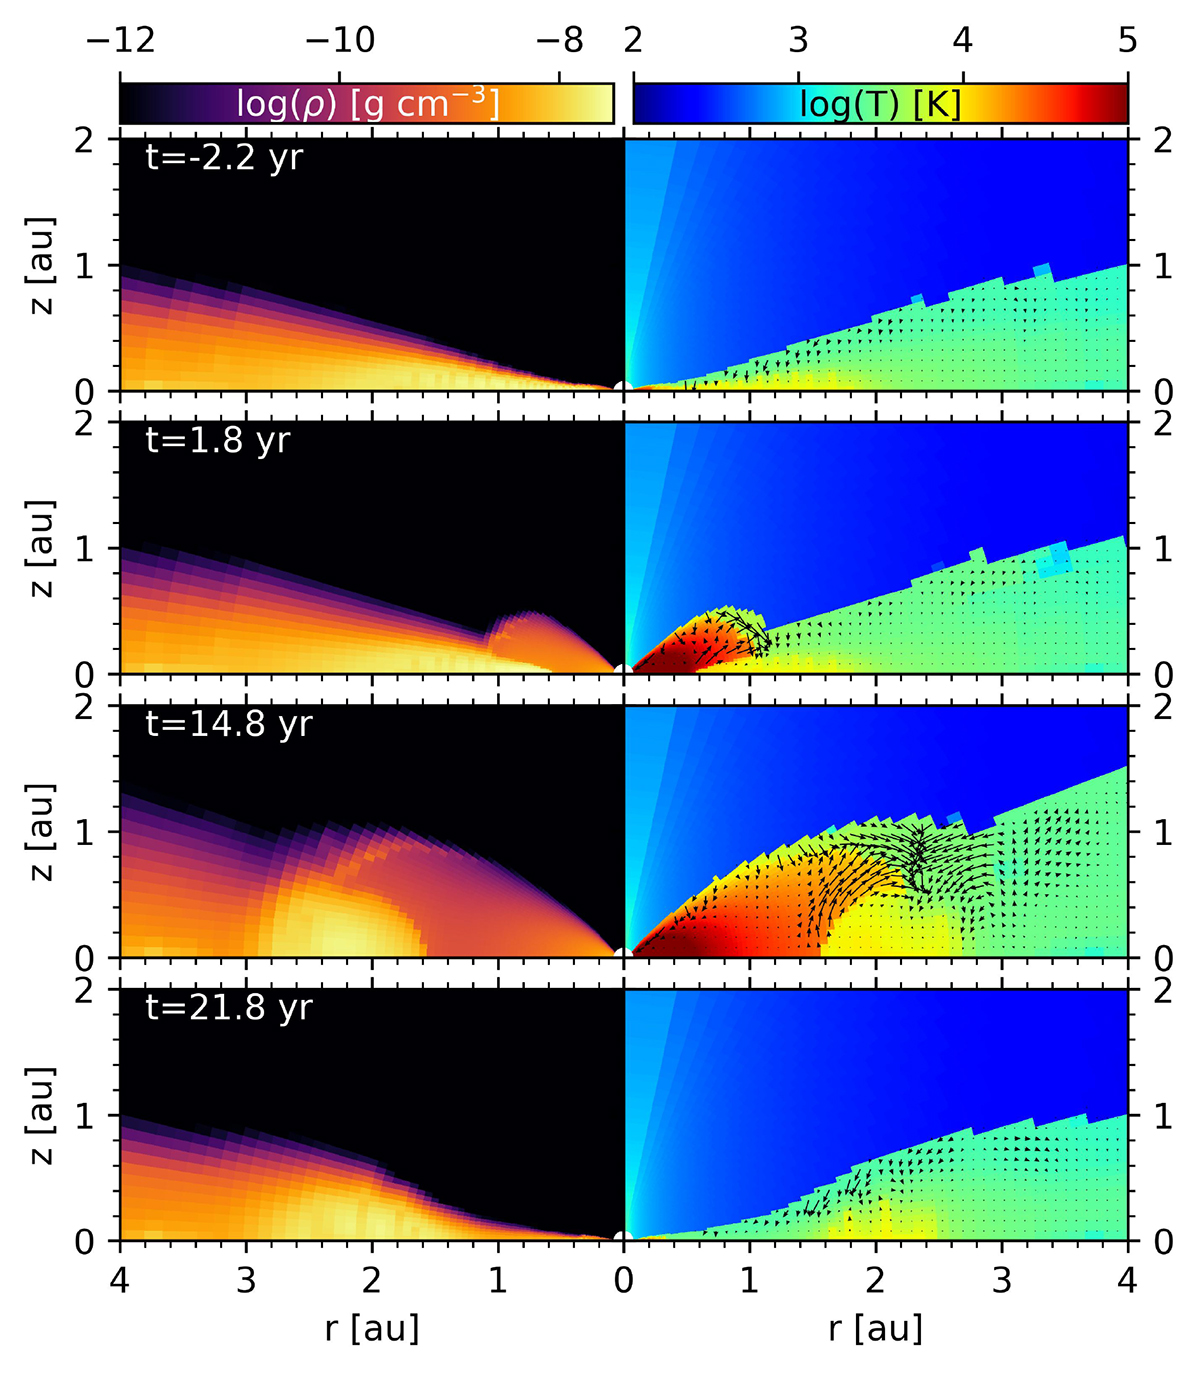
Fig. 3.
Download original image
Density and temperature during the bursts in 2D distributions (r-z plane) of density (left panels) and temperature (right panels) at four different time instances during a TI outburst. Black arrows in the right panels show the total velocity field. As the outburst progresses, the inner disk heats up and expands vertically, while the density structure adjusts to the higher temperatures. Later, the disk begins to cool and partially recollapse, illustrating the transient nature of TI-driven events in HMYSO disks.
Current usage metrics show cumulative count of Article Views (full-text article views including HTML views, PDF and ePub downloads, according to the available data) and Abstracts Views on Vision4Press platform.
Data correspond to usage on the plateform after 2015. The current usage metrics is available 48-96 hours after online publication and is updated daily on week days.
Initial download of the metrics may take a while.