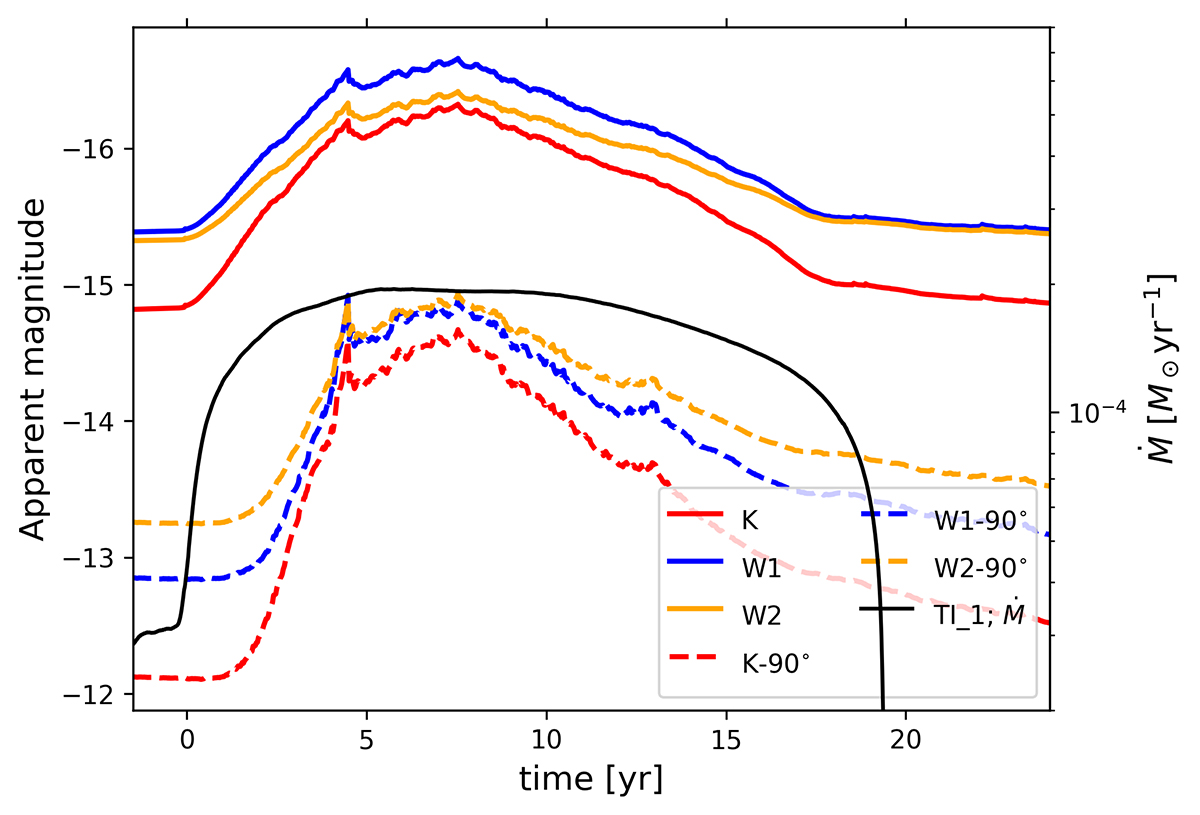
Fig. 5.
Download original image
Infrared light curves of the TI outburst in model TI_1. The curves represent the K (red), W1 (blue), and W2 (orange) bands, with the black solid line showing the accretion rate, Ṁ, for reference. The solid lines correspond to a face-on disk orientation, while additional light curves (dashed lines) illustrate the effect of a 90° (edge-on) inclination.
Current usage metrics show cumulative count of Article Views (full-text article views including HTML views, PDF and ePub downloads, according to the available data) and Abstracts Views on Vision4Press platform.
Data correspond to usage on the plateform after 2015. The current usage metrics is available 48-96 hours after online publication and is updated daily on week days.
Initial download of the metrics may take a while.