Fig. 3.
Download original image
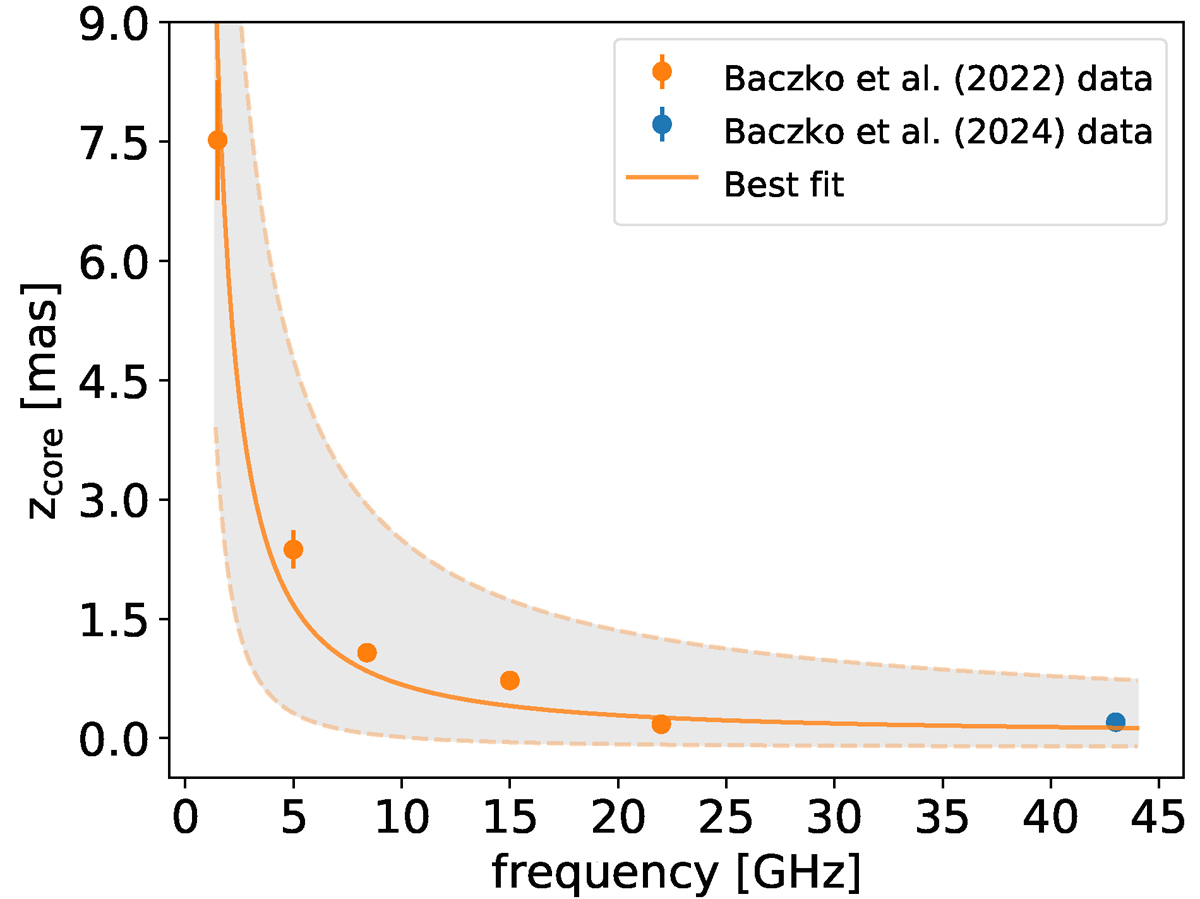
Core shift of the eastern jet as a function of the frequency. The orange data points are taken from Baczko et al. (2022), and the 43 GHz blue data point is taken from Baczko et al. (2024). The continuous orange line represents the best fit, and the dashed lines represent the corresponding upper and lower limits. The gray area shows the possible best-fit line within 1σ.
Current usage metrics show cumulative count of Article Views (full-text article views including HTML views, PDF and ePub downloads, according to the available data) and Abstracts Views on Vision4Press platform.
Data correspond to usage on the plateform after 2015. The current usage metrics is available 48-96 hours after online publication and is updated daily on week days.
Initial download of the metrics may take a while.