Fig. 5.
Download original image
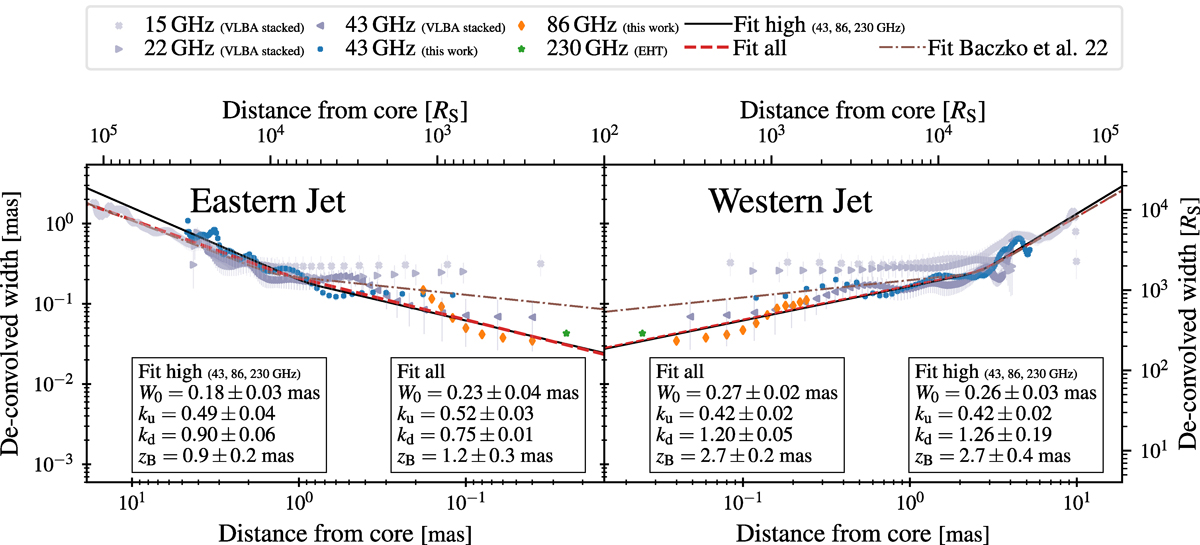
Deconvolved jet width as a function of the distance from the core for the eastern and western jet. This plot, originally published in Baczko et al. (2024), is updated with the new profiles at 43 GHz and 86 GHz we extrapolated. We show three different fits: i) black continuous line, best-fit line for the high frequency data (43, 86, and 230 GHz); ii) red dashed line, best-fit line for all the data; iii) brown dot-dashed line, best-fit line reported in Baczko et al. (2022). In the tables, W0 are the initial jet widths, ku and kd are the upstream and downstream power law indexes, respectively, and zb are the transition distances.
Current usage metrics show cumulative count of Article Views (full-text article views including HTML views, PDF and ePub downloads, according to the available data) and Abstracts Views on Vision4Press platform.
Data correspond to usage on the plateform after 2015. The current usage metrics is available 48-96 hours after online publication and is updated daily on week days.
Initial download of the metrics may take a while.