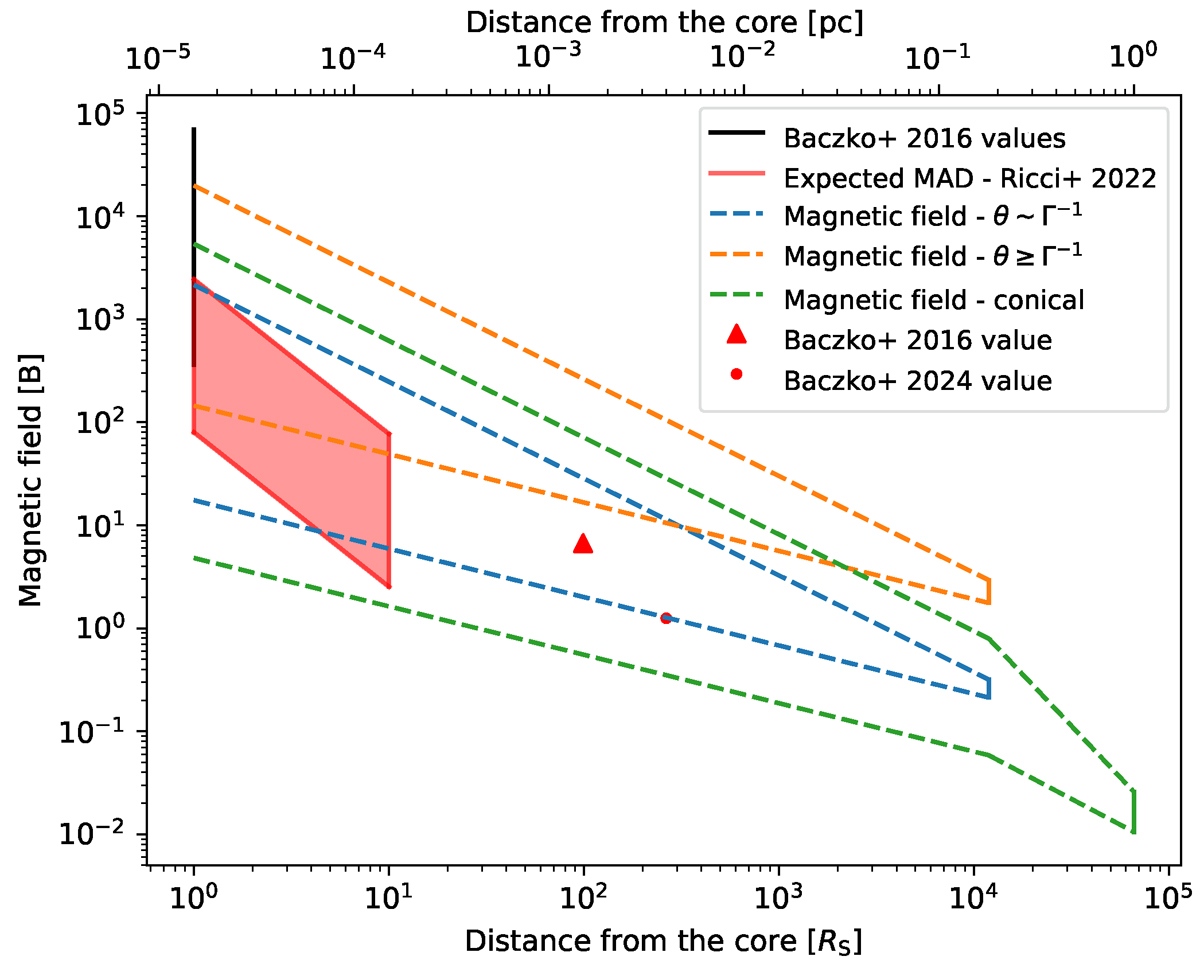
Fig. 8.
Download original image
Average spatial magnetic field evolution for the two jets in NGC 1052. The horizontal black line represents the magnetic field strength estimates Baczko et al. (2016) at 1 RS, and the vertical green, blue, and orange lines show the values (with their uncertainties) from Equations (5), (6), and (7), respectively. The dashed lines show the extrapolation assuming b = 0.47 and b = 0.94 (B ∝ z−b) for the parabolic region and b = 1.0 and b = 2.0 for the conical region. The red triangle is a lower limit estimate for the magnetic field from Baczko et al. (2016), and the red dot is taken from Baczko et al. (2024). The red box represents the magnetic field that is expected to be needed to saturate the accretion disk.
Current usage metrics show cumulative count of Article Views (full-text article views including HTML views, PDF and ePub downloads, according to the available data) and Abstracts Views on Vision4Press platform.
Data correspond to usage on the plateform after 2015. The current usage metrics is available 48-96 hours after online publication and is updated daily on week days.
Initial download of the metrics may take a while.