Fig. 1.
Download original image
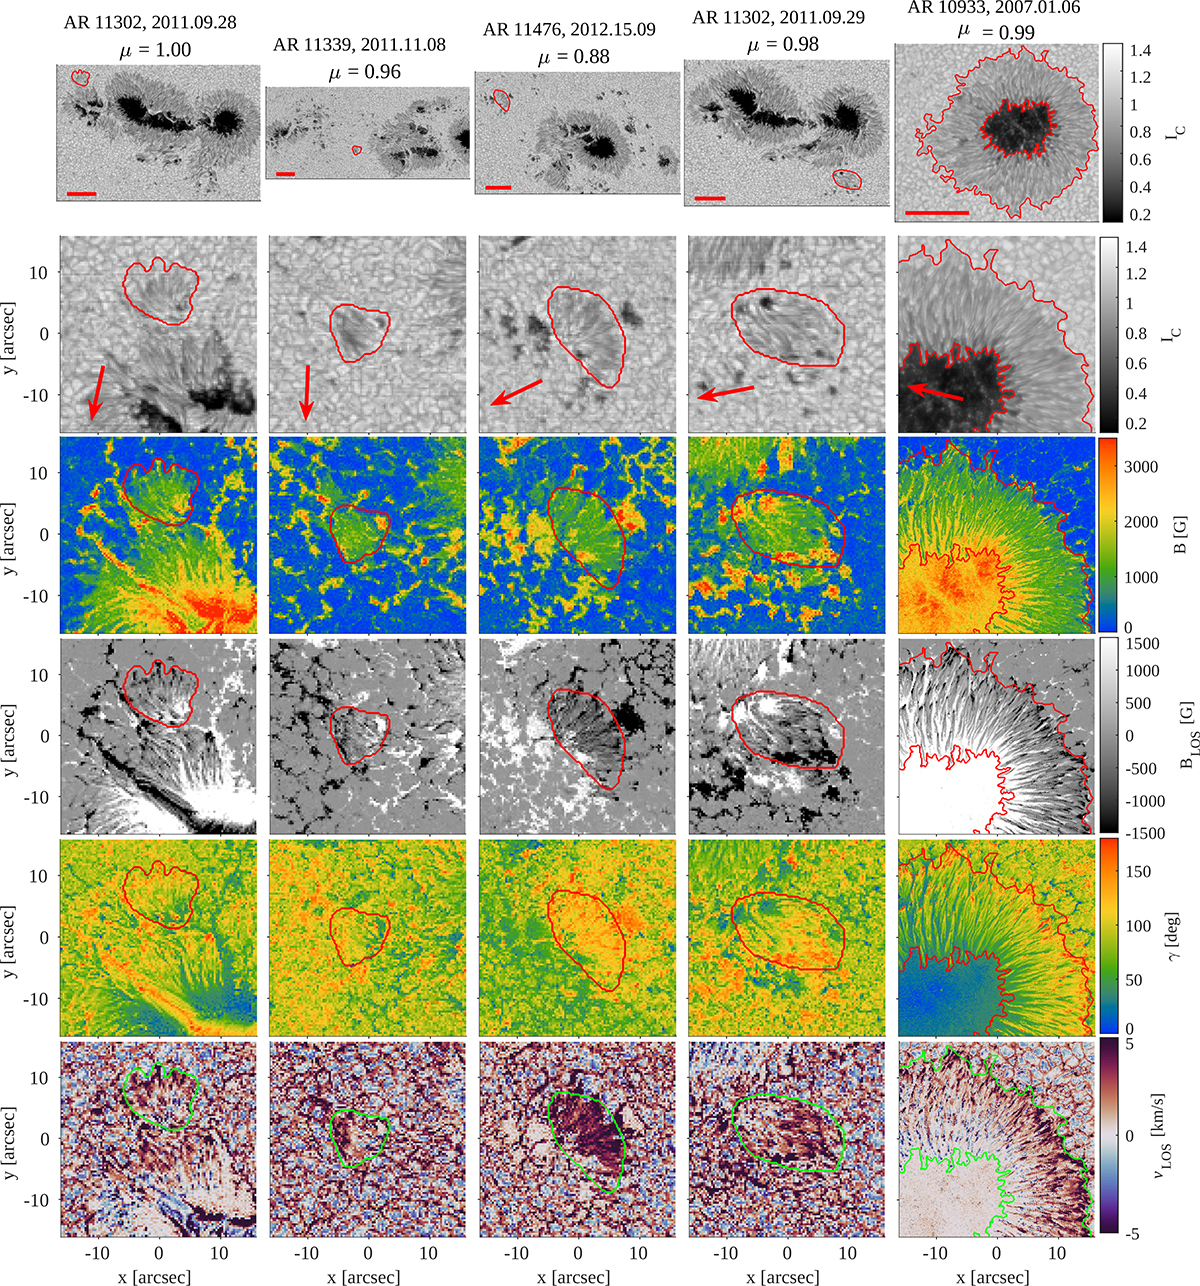
Observables of selected OPUs. The four columns on the left show different examples of OPUs. The rightmost column shows the penumbra of a sunspot for comparison (AR 10933 observed on 6 January 2007). The top row shows continuum intensity maps (Ic) covering using the full FOV of the Hinode/SOT-SP scan. The rows below cover a smaller FOV of 32″ × 32″ centred on the individual OPUs (or sunspot penumbra in the rightmost column). Rows 2 to 6 show the Ic of the region of interest, strength of the magnetic field B, longitudinal component of the magnetic field BLOS, inclination of the magnetic field γ relative to the line-of-sight, and the LOS velocity vLOS, respectively. In all panels, the contours indicate the OPUs (or sunspot penumbra in the rightmost column). We adjusted the dominant polarity of BLOS to be positive in the individual OPUs for better comparison. We show the magnetic field information and the velocity at τ = 1. The red horizontal lines in the top row indicate a length of 20″ and the arrows in the second-row point towards disk centre.
Current usage metrics show cumulative count of Article Views (full-text article views including HTML views, PDF and ePub downloads, according to the available data) and Abstracts Views on Vision4Press platform.
Data correspond to usage on the plateform after 2015. The current usage metrics is available 48-96 hours after online publication and is updated daily on week days.
Initial download of the metrics may take a while.