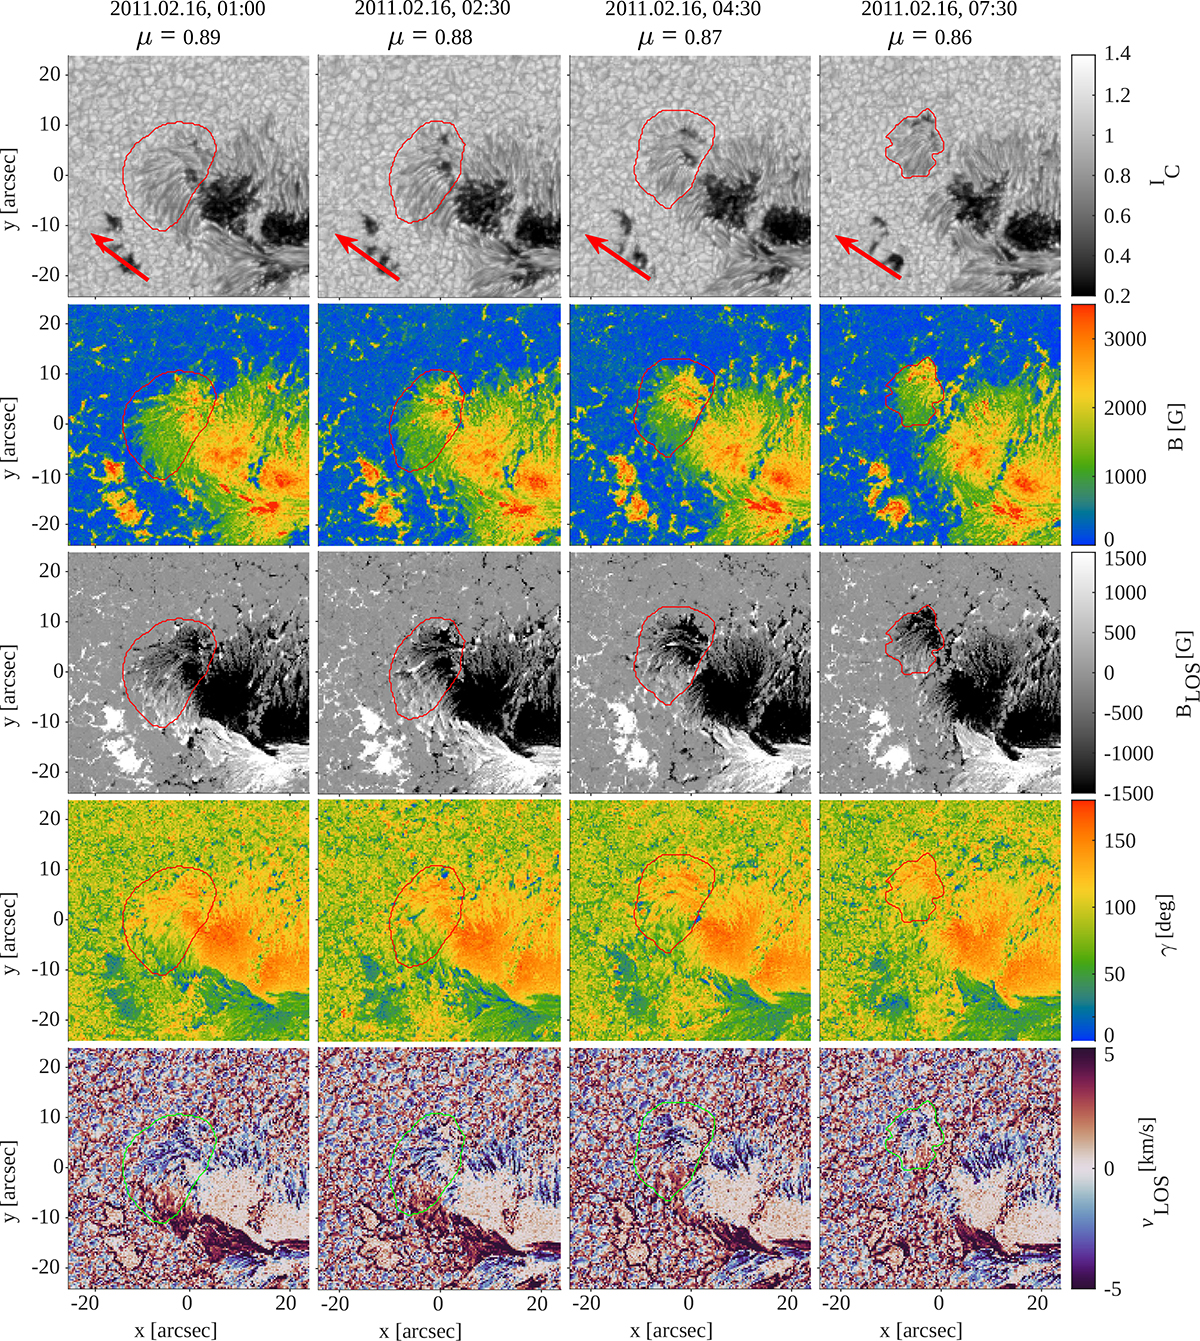
Fig. 3.
Download original image
Time series showing the formation of an OPU in AR 11158. The individual columns show the observables of the OPU at different times, from 1:00 UT to 7:30 UT on 16 February 2011. From top to bottom:Ic, B, BLOS, γ, and vLOS, i.e. the same quantities in the same order as in Fig. 1. All panels have a FOV of 48″ × 48″ and the contours indicate the orphan penumbra. This OPU forms by separating from a sunspot. We show the magnetic field and the velocity at τ = 1. The arrows in the top row point towards disk centre.
Current usage metrics show cumulative count of Article Views (full-text article views including HTML views, PDF and ePub downloads, according to the available data) and Abstracts Views on Vision4Press platform.
Data correspond to usage on the plateform after 2015. The current usage metrics is available 48-96 hours after online publication and is updated daily on week days.
Initial download of the metrics may take a while.