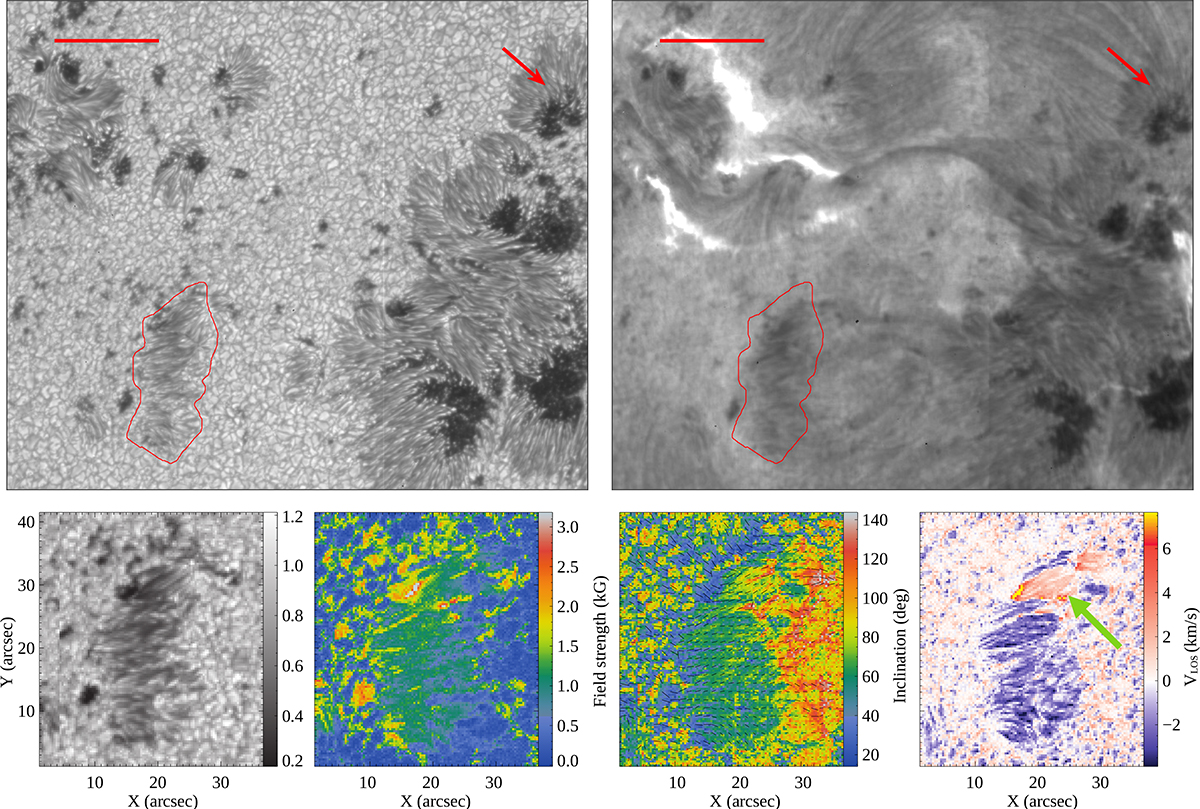
Fig. 7.
Download original image
Top row: Maps of the continuum intensity (left) and of the Hα line core intensity (right) of AR 11339 on 6 November 2011 obtained by Hinode/SOT-FG. The red contour highlights the position of an OPU. The horizontal line indicates a length of 20″ and the arrow points towards disk centre. The AR was located at a heliocentric angle μ = 0.89. Botton row: Panels displayed from left to right show the maps of the OPU of the continuum, magnetic field strength, inclination and azimuth (black lines), and LOS velocity.
Current usage metrics show cumulative count of Article Views (full-text article views including HTML views, PDF and ePub downloads, according to the available data) and Abstracts Views on Vision4Press platform.
Data correspond to usage on the plateform after 2015. The current usage metrics is available 48-96 hours after online publication and is updated daily on week days.
Initial download of the metrics may take a while.