Fig. 10.
Download original image
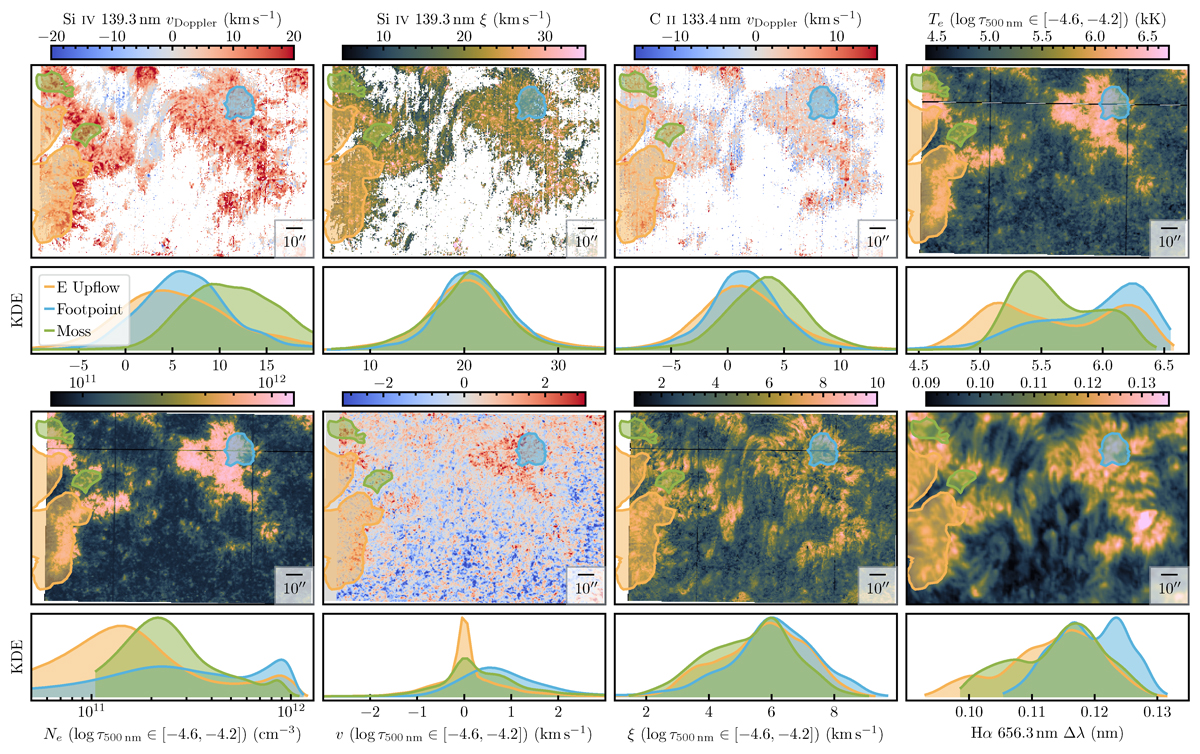
Line Doppler shifts and other thermodynamic properties in the eastern upflow region (orange), footprints of closed loops with blueshifts of approximately −5 km s−1 in Fe XII (blue), and AR moss with redshifts of approximately 5 km s−1 in Fe XII (green). Top row from left to right: Si IV 139.3 nm Doppler velocity; Si IV 139.3 nm nonthermal velocity ξ; C II 133.4 nm Doppler velocity; IRIS2 inverted electron temperature Te averaged between log τ500 nm from −4.6 to −4.2 where Mg II h&k lines form. Bottom row from left to right: Average inverted electron density Ne; Average inverted Doppler shift; Average inverted nonthermal velocity ξ; Hα line core width Δλ. Link to the Jupyter notebook creating this figure: 📘.
Current usage metrics show cumulative count of Article Views (full-text article views including HTML views, PDF and ePub downloads, according to the available data) and Abstracts Views on Vision4Press platform.
Data correspond to usage on the plateform after 2015. The current usage metrics is available 48-96 hours after online publication and is updated daily on week days.
Initial download of the metrics may take a while.