Fig. 11.
Download original image
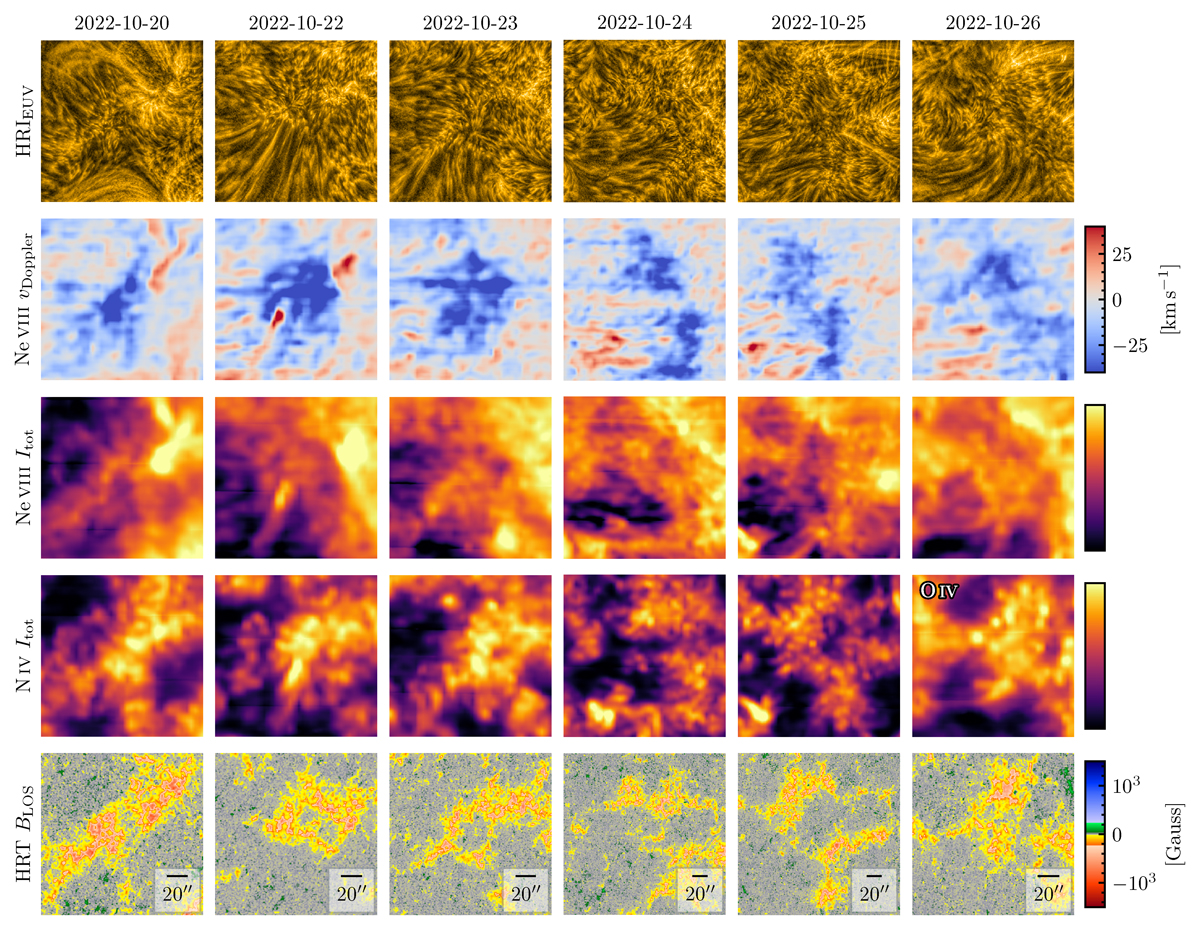
Eastern upflow regions identified by the blueshifts in Ne VIII 77.04 nm Dopplergrams observed by SPICE from 2022 October 20 to October 26. First row: HRIEUV images; Second row: SPICE Ne VIII Dopplergrams; Third row: SPICE Ne VIII intensity maps; Fourth row: SPICE N IV 76.51 nm intensity maps, except for the October 26 one, which was replaced by the O IV 78.77 nm intensity; Last row: PHI/HRT LOS magnetograms. Note that the scale bars vary among different dates. Link to the Jupyter notebook creating this figure: 📘.
Current usage metrics show cumulative count of Article Views (full-text article views including HTML views, PDF and ePub downloads, according to the available data) and Abstracts Views on Vision4Press platform.
Data correspond to usage on the plateform after 2015. The current usage metrics is available 48-96 hours after online publication and is updated daily on week days.
Initial download of the metrics may take a while.