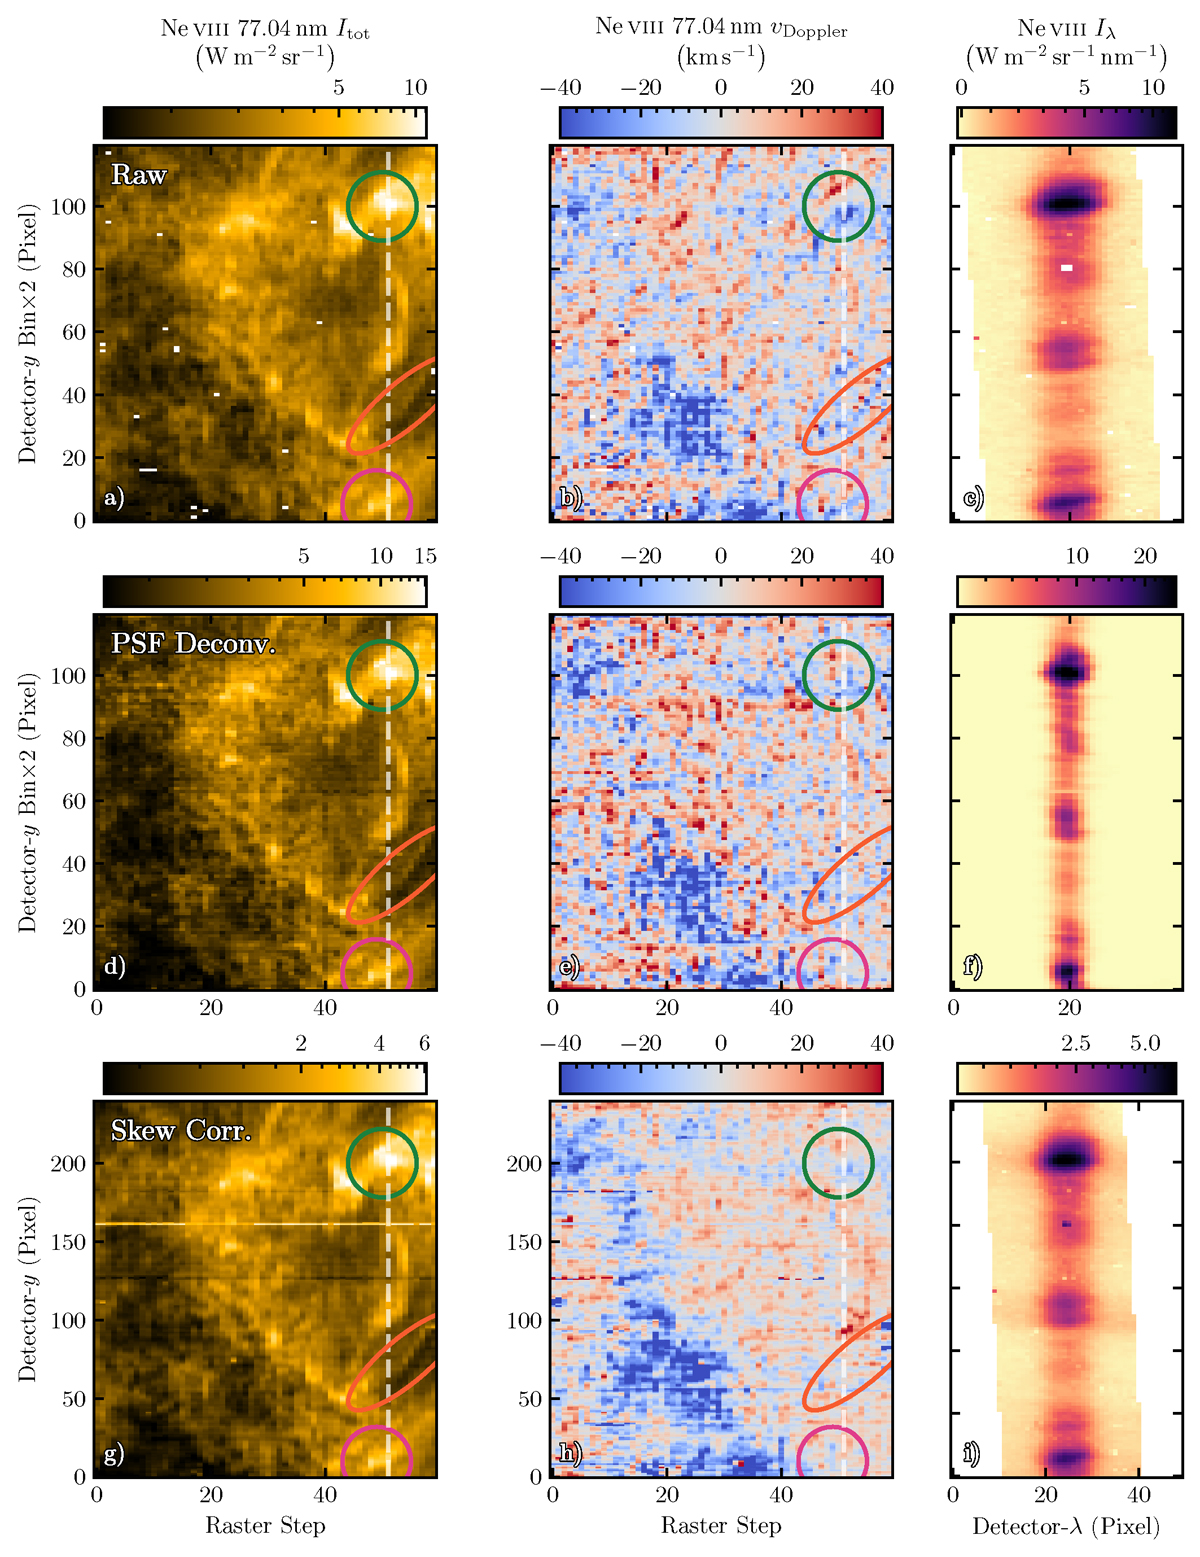
Fig. C.2.
Download original image
Comparison between the Ne VIII 77.04 nm profiles before (top) and after PSF deconvolution (middle) or “skew” correction (bottom) near the eastern upflow region. Panels (a), (d), and (g) show Ne VIII line intensity. Panels (b), (e), and (h) show Doppler shifts. Panels (c), (f), and (i) display spectra along the dashed vertical lines in other panels, respectively. Regions potentially affected by spurious velocity signals are highlighted by circles. Link to the Jupyter notebook creating this figure: 📘.
Current usage metrics show cumulative count of Article Views (full-text article views including HTML views, PDF and ePub downloads, according to the available data) and Abstracts Views on Vision4Press platform.
Data correspond to usage on the plateform after 2015. The current usage metrics is available 48-96 hours after online publication and is updated daily on week days.
Initial download of the metrics may take a while.