Fig. D.1.
Download original image
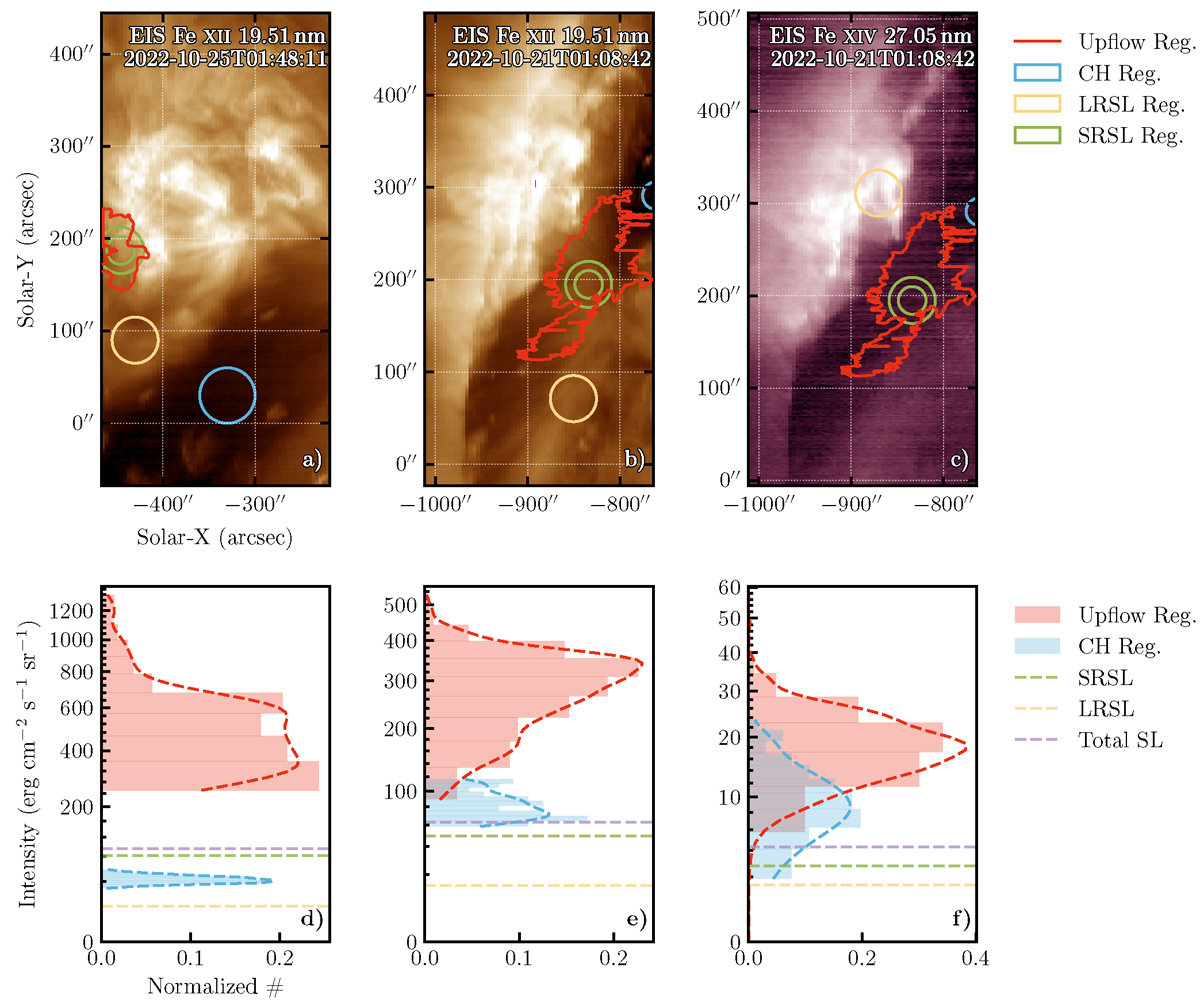
Estimation of EIS stray light intensity in upflow regions. Panels (a)–(c): EIS intensity maps of Fe XII 19.51 nm and Fe XIV 27.05 nm lines. Different colors outline the selected regions: upflows–red polygons; coronal holes–blue circles; long-range stray light (LRSL) reference regions–yellow circles; short-range stray light (SRSL) regions–green annulus. The intensity distributions in upflow regions and ambient coronal holes and estimated short-range stray light and long-range stray light intensities are shown in Panels (d)–(f) below, corresponding to Panels (a)–(c), respectively. Link to the Jupyter notebook creating this figure: 📘.
Current usage metrics show cumulative count of Article Views (full-text article views including HTML views, PDF and ePub downloads, according to the available data) and Abstracts Views on Vision4Press platform.
Data correspond to usage on the plateform after 2015. The current usage metrics is available 48-96 hours after online publication and is updated daily on week days.
Initial download of the metrics may take a while.