Fig. 3.
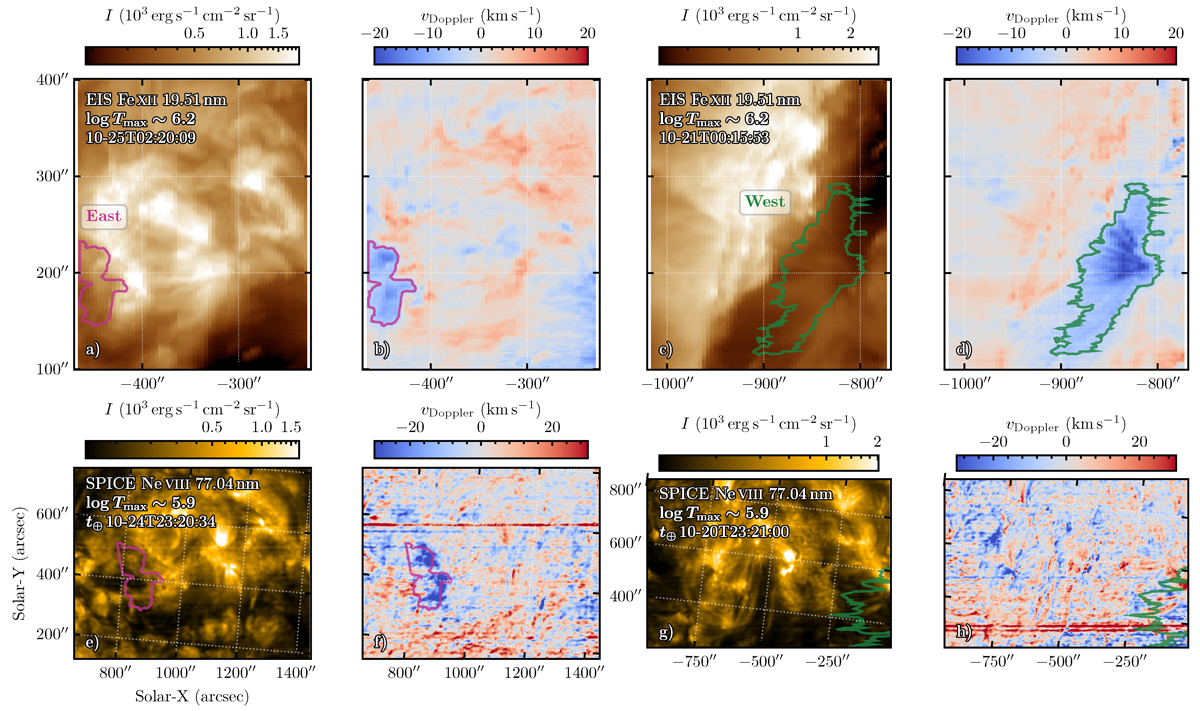
Download original image
EIS and SPICE intensity and Doppler shift maps in Fe XII 19.51 nm (EIS) and Ne VIII 77.04 nm lines of the eastern (purple) and western (green) upflow regions. Datasets obtained on different dates are shown due to the limited FOVs of EIS and SPICE. The eastern region was observed by EIS when the AR was near the disk center (e.g., 2022 October 24), while the western region was captured by EIS when the AR was close to the limb (e.g., October 20). Panels (a) and (b): Eastern upflow region in EIS; Panels (c) and (d): Western upflow region in EIS; Panels (e) and (f): Eastern upflow region in SPICE; Panels (g) and (h): Western upflow region in SPICE. Note that the spatial scales of SPICE and EIS in arcsec are different because Solar Orbiter was positioned at approximately 0.5 AU from the Sun. Link to the Jupyter notebook creating this figure: 📘.
Current usage metrics show cumulative count of Article Views (full-text article views including HTML views, PDF and ePub downloads, according to the available data) and Abstracts Views on Vision4Press platform.
Data correspond to usage on the plateform after 2015. The current usage metrics is available 48-96 hours after online publication and is updated daily on week days.
Initial download of the metrics may take a while.