Fig. 5.
Download original image
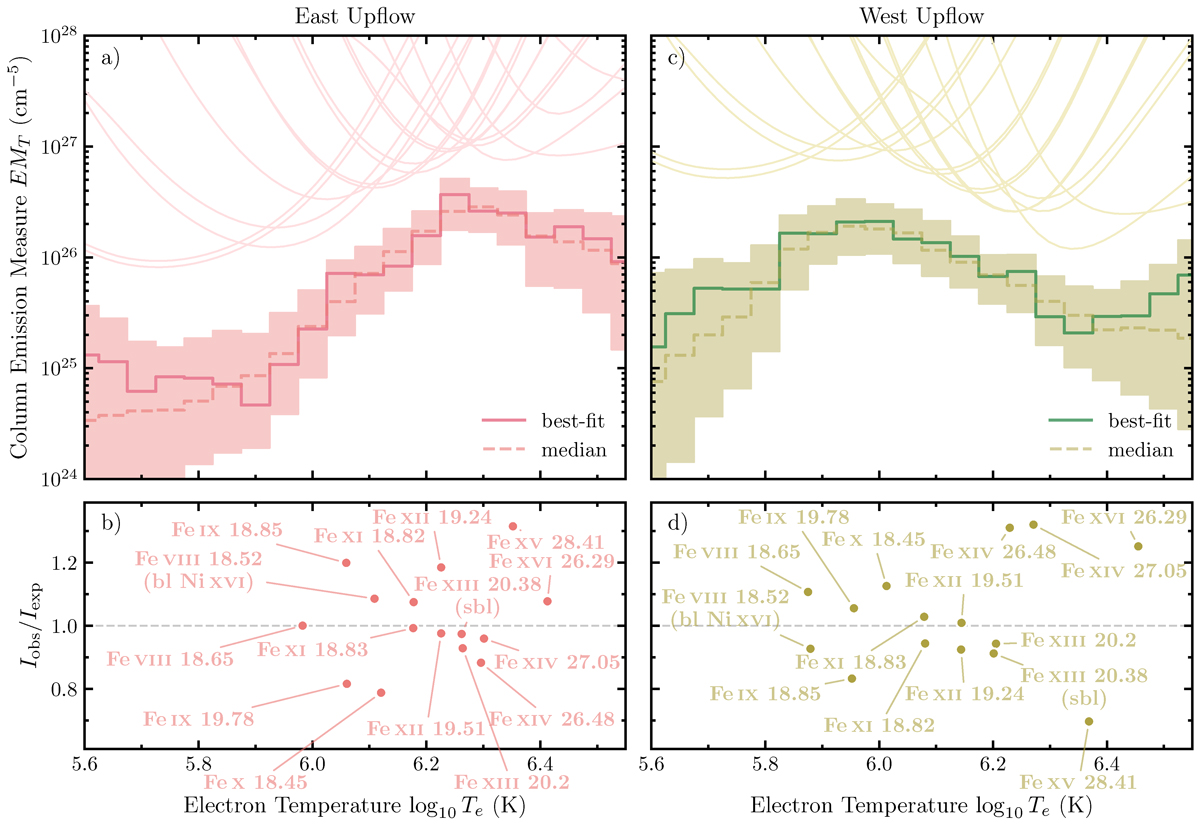
Differential emission measure (DEM) diagnostics of the two upflow regions. Panels (a) and (b) show the results in the eastern upflow region, and panels (c) and (d) are from the western region (see contours in Figure 3). Column emission measure EMT(T) = DEM(T)ΔT was inferred by an MCMC approach. The upper panels show the best-fit EMT in solid lines and the median EMT of 1000 batches in dashed lines. The shaded areas outline the confidence bounds of the MCMC inference. The EM loci (Iobs/G(Te)) curves of the input lines are also shown above the EMT curves. The bottom panels show the ratios between the observed line intensity Iobs and expected line intensity Iexp modeled by the best-fit DEM, as a function of the DEM-weighted effective formation temperature. Link to the Jupyter notebook creating this figure: 📘.
Current usage metrics show cumulative count of Article Views (full-text article views including HTML views, PDF and ePub downloads, according to the available data) and Abstracts Views on Vision4Press platform.
Data correspond to usage on the plateform after 2015. The current usage metrics is available 48-96 hours after online publication and is updated daily on week days.
Initial download of the metrics may take a while.