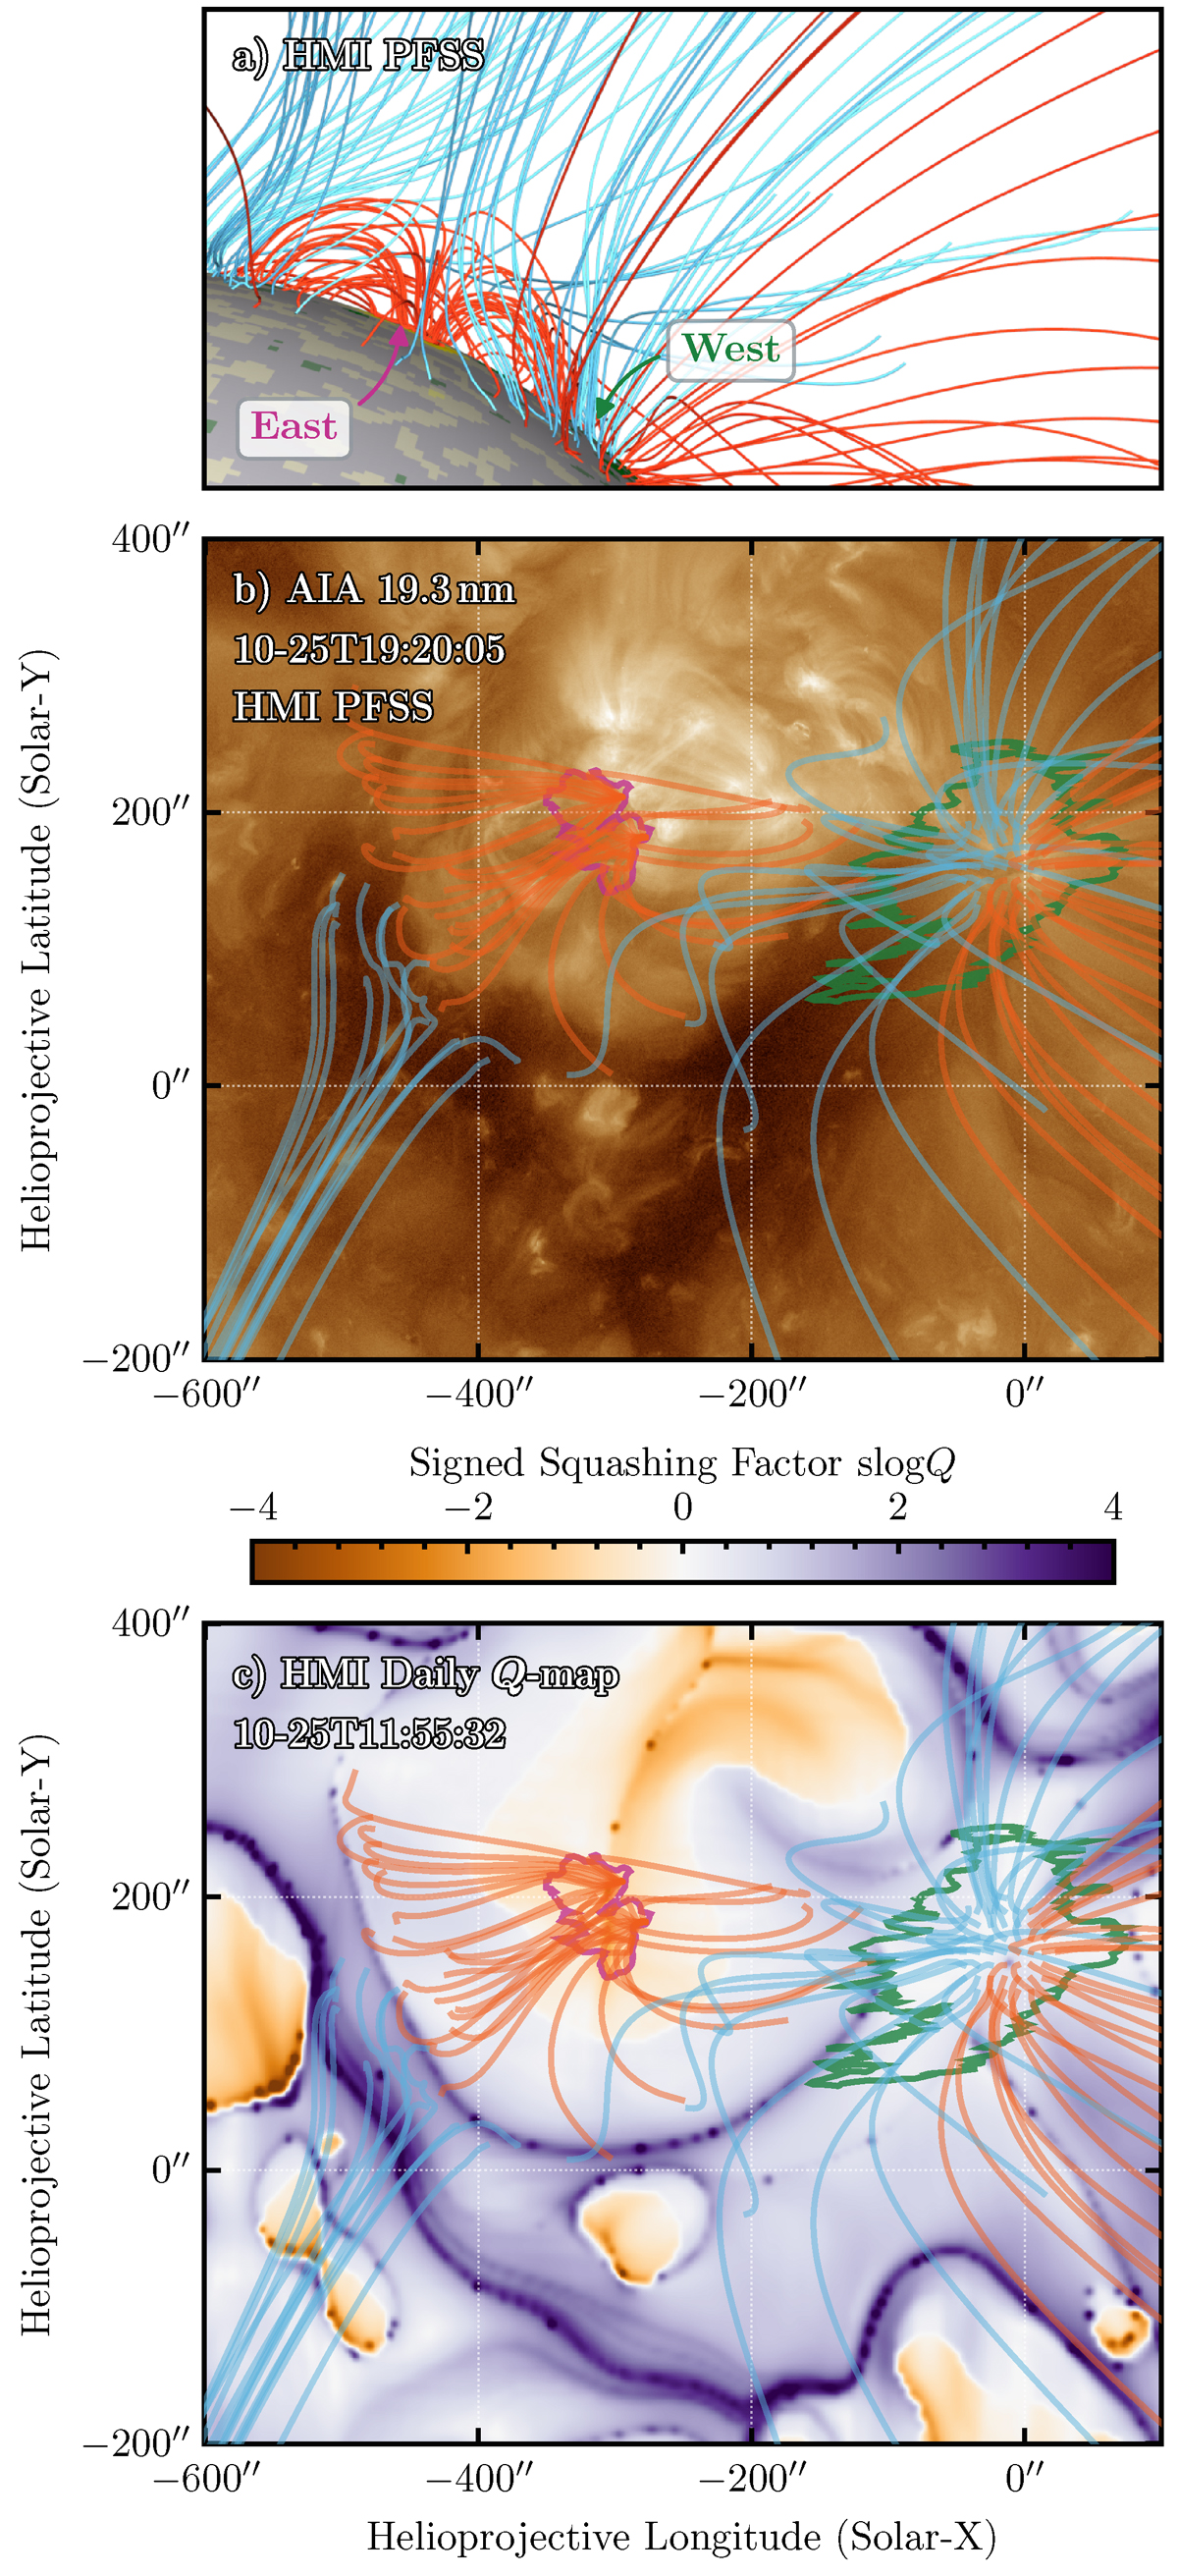
Fig. 6.
Download original image
Magnetic field lines traced from the upflow regions using PFSS extrapolation. Open field lines are in blue, while closed field lines are colored red. (a) A side view of the field lines originated in the AR and ambient coronal holes. (b) Extrapolated field lines from the eastern (purple) and western (green) upflow regions and the ambient coronal hole with SDO/AIA 19.3 nm image. (c) Extrapolated field lines overplotted on the SDO/HMI signed squashing factor Q map. Link to the Jupyter notebook creating this figure: 📘.
Current usage metrics show cumulative count of Article Views (full-text article views including HTML views, PDF and ePub downloads, according to the available data) and Abstracts Views on Vision4Press platform.
Data correspond to usage on the plateform after 2015. The current usage metrics is available 48-96 hours after online publication and is updated daily on week days.
Initial download of the metrics may take a while.