Fig. 7.
Download original image
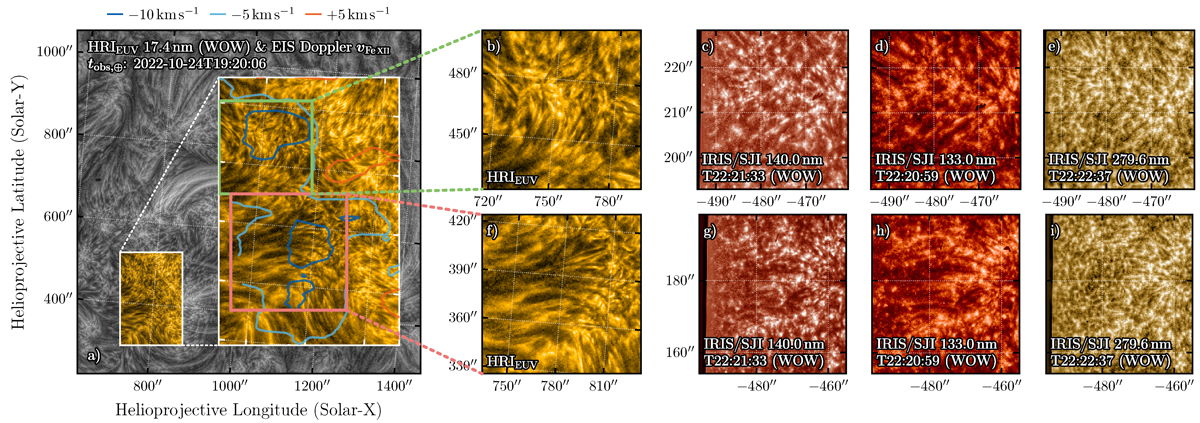
Eastern upflow region observed by HRIEUV (WOW-enhanced) and IRIS/SJI on 2022 October 24 (online movies 1 and 2). (a) Zoom in plot of the eastern upflow region with EIS Doppler velocity contours overplotted (legends above panel a). (b) HRIEUV image of the top subregion. Panels (c)–(e) IRIS/SJI images of the top subregion in different channels. Panels (f)–(i) are the same as panels (c)–(e) but for the bottom subregion. The evolution of dynamic fibrils is available as online movies 1 and 2. Link to the Jupyter notebook creating this figure: 📘.
Current usage metrics show cumulative count of Article Views (full-text article views including HTML views, PDF and ePub downloads, according to the available data) and Abstracts Views on Vision4Press platform.
Data correspond to usage on the plateform after 2015. The current usage metrics is available 48-96 hours after online publication and is updated daily on week days.
Initial download of the metrics may take a while.