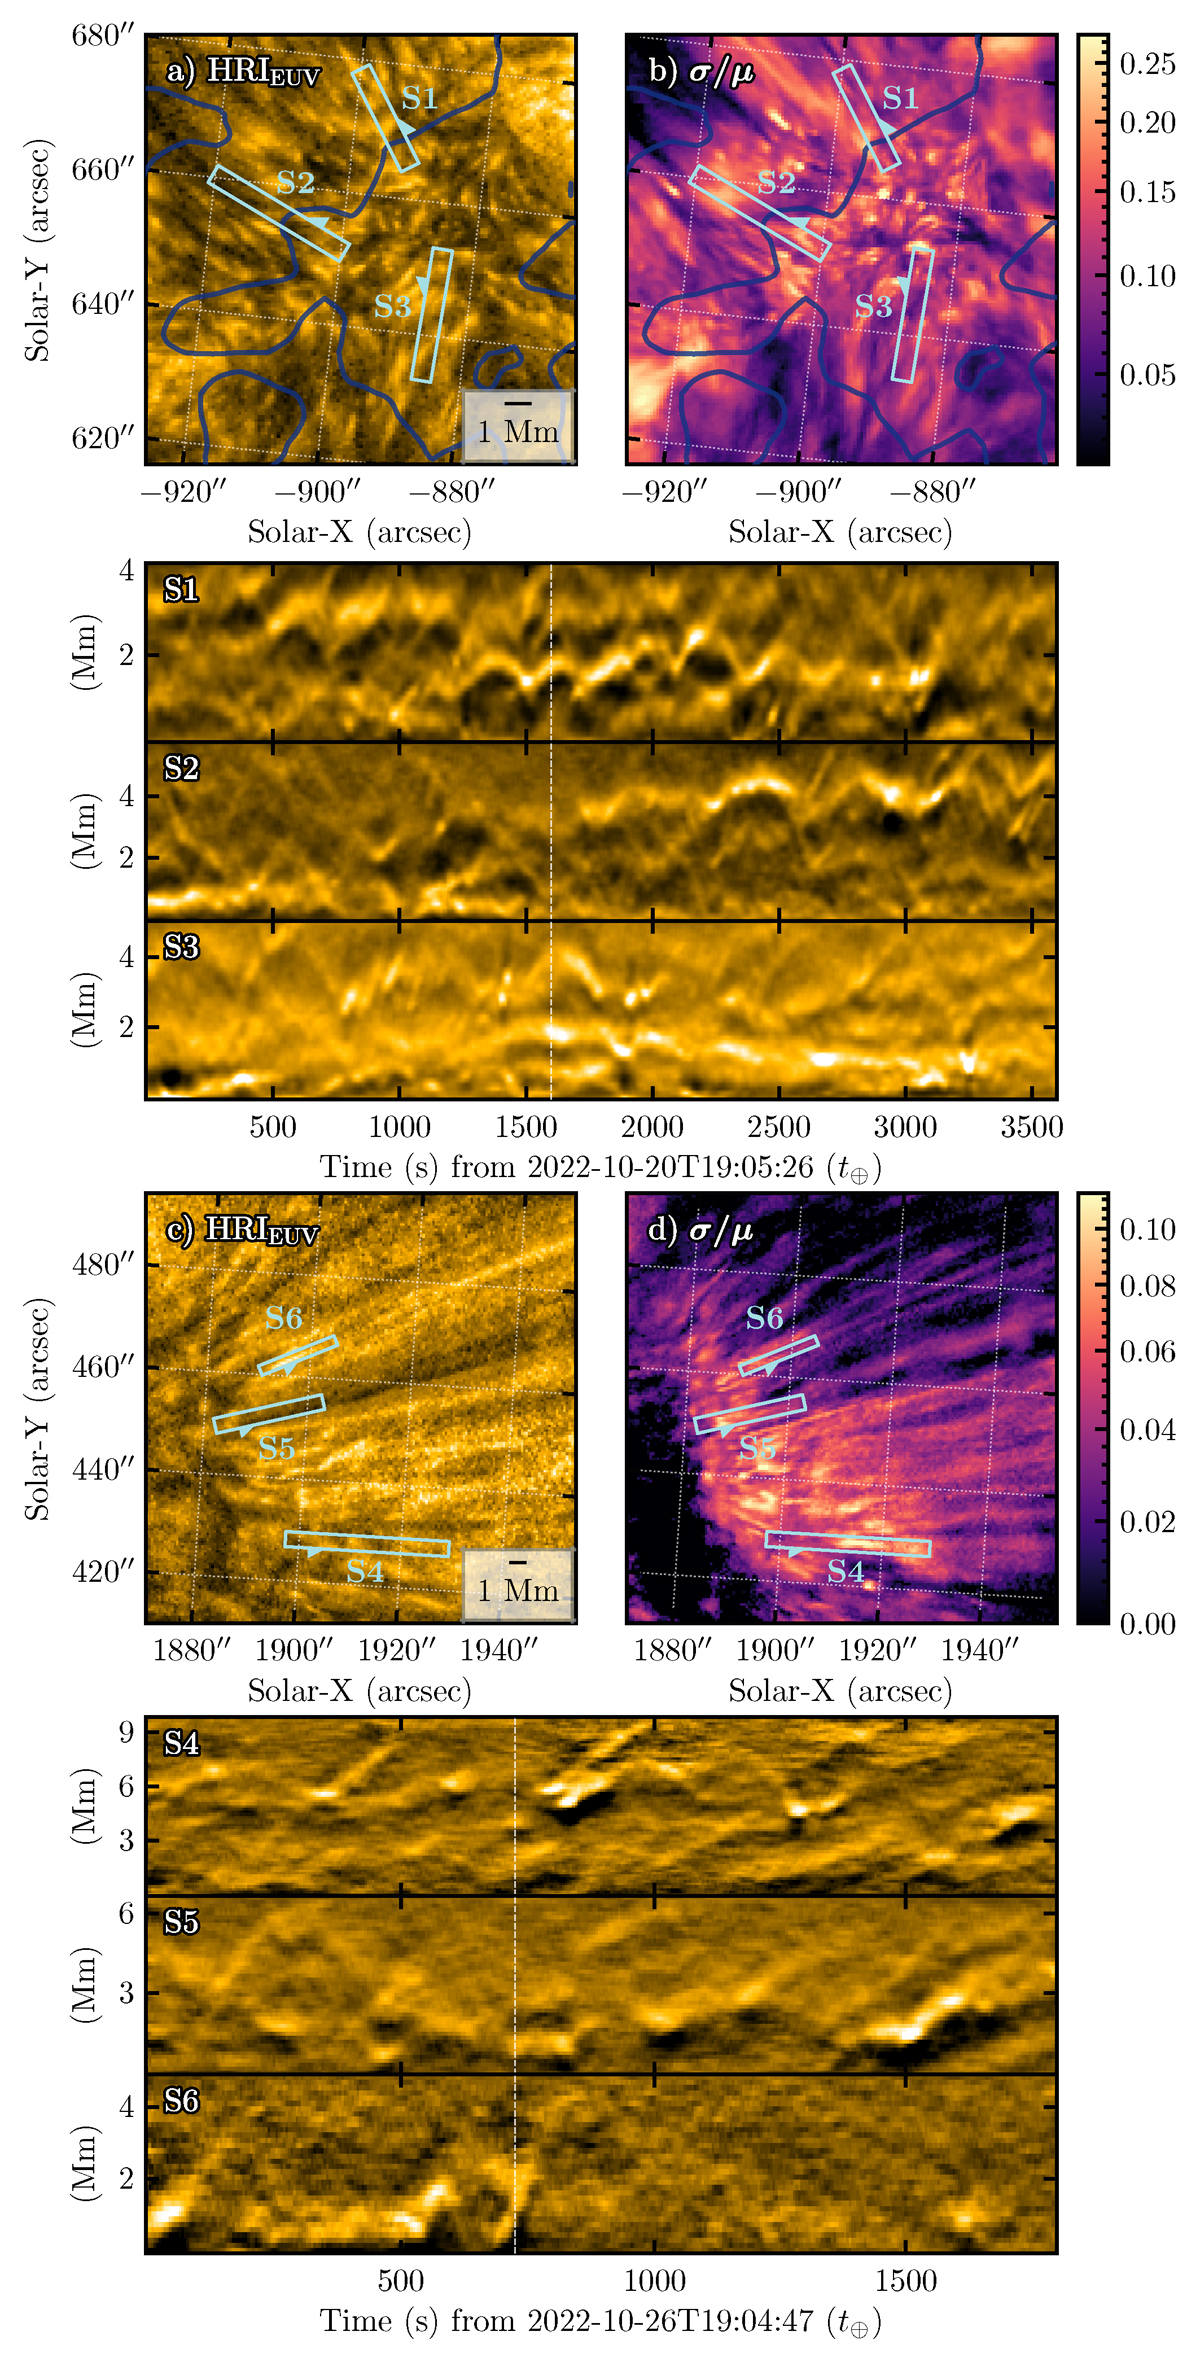
Fig. 9.
Download original image
Small-scale dynamics in both upflow regions revealed in standard deviation maps and stack plots. (a) WOW-enhanced HRIEUV image and artificial slits S1, S2, and S3 in the eastern upflow region on 2022 October 20. (b) Standard deviations of HRIEUV image normalized by average. (S1–3) stack plots along slits S1, S2, and S3. Panels (c) and (d) are the same as panels (a) and (b), respectively, but for the western upflow region on October 26. Panels (S4–6) are stack plots along the slits S4–6 in panels (c) and (d). The vertical lines in the stack plots represent the observation time of HRIEUV images in panels (a) and (c). Link to the Jupyter notebook creating this figure: 📘.
Current usage metrics show cumulative count of Article Views (full-text article views including HTML views, PDF and ePub downloads, according to the available data) and Abstracts Views on Vision4Press platform.
Data correspond to usage on the plateform after 2015. The current usage metrics is available 48-96 hours after online publication and is updated daily on week days.
Initial download of the metrics may take a while.