Fig. 4
Download original image
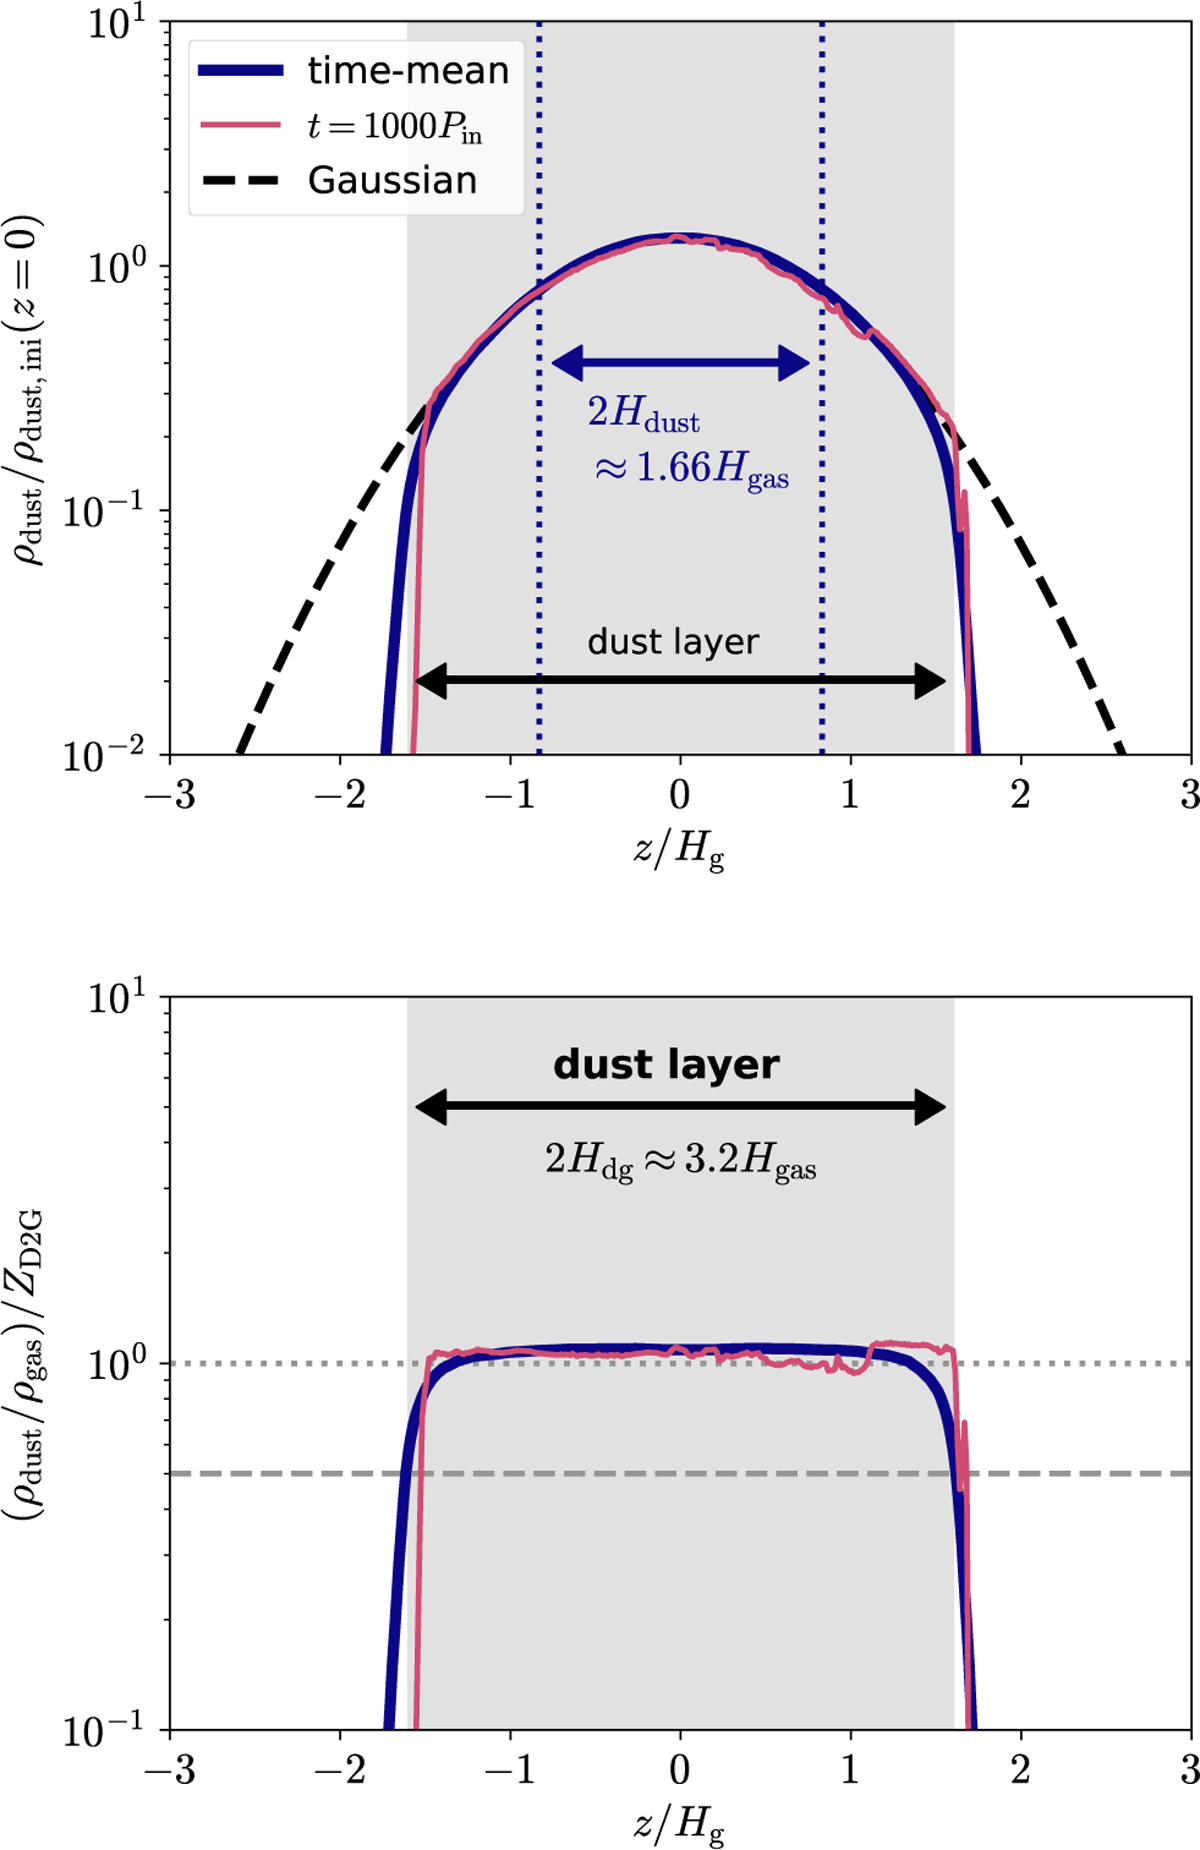
Vertical profiles of the dust density ρdust normalized by the initial dust density at the midplane ρdust,ini(z = 0) (upper panel), and ratio of dust and gas densities ρdust/ρgas normalized by the initial dust-to-gas mass ratio ZD2G (lower panel), at R = 40 au for a run with (ZD2G, a)= (0.01, 10 μm) in the dynamic-dust simulations. In the upper panel, the dashed curve shows a Gaussian fitting of ρdust within |z|<Hdg, and the vertical dotted lines mark the height of the dust scale height Hdust. The horizontal dashed and dotted lines in the lower panel mark ρdust/ρgas = ZD2G/2 and ZD2G, respectively. The gray regions in both panels map the dust layer defined by Hdg.
Current usage metrics show cumulative count of Article Views (full-text article views including HTML views, PDF and ePub downloads, according to the available data) and Abstracts Views on Vision4Press platform.
Data correspond to usage on the plateform after 2015. The current usage metrics is available 48-96 hours after online publication and is updated daily on week days.
Initial download of the metrics may take a while.