Fig. 6
Download original image
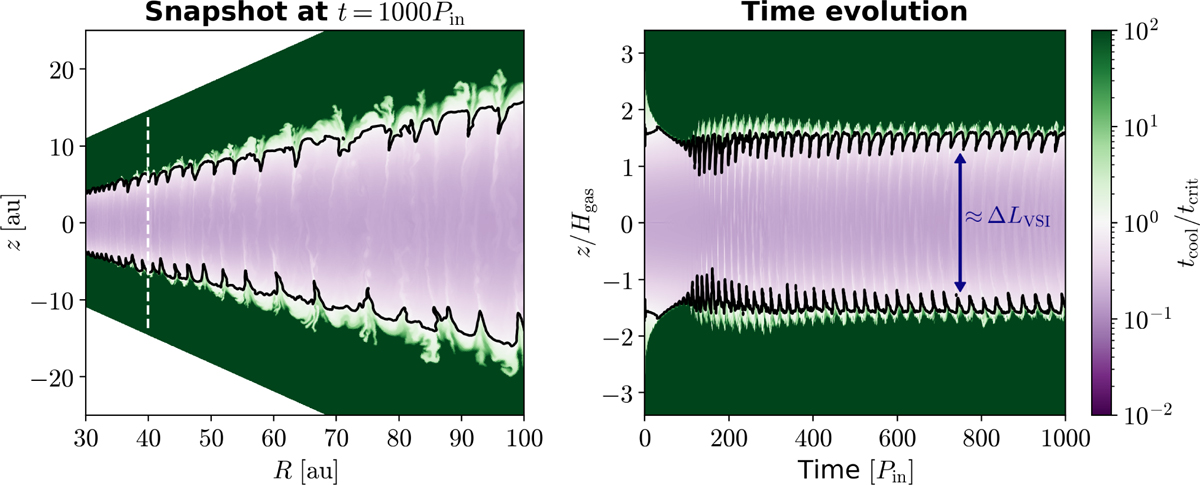
Left panel: cooling timescale tcool normalized by the critical timescale tcrit for a run with (ZD2G, a) = (0.01, 10 μm) in the dynamic-dust simulations as a function of R and z at t = 1000 Pin. The solid lines mark tcool = tcrit. The dashed line indicates R = 40 au. Right panel: time evolution of tcool/tcrit for the same run as the left panel at R = 40 au.
Current usage metrics show cumulative count of Article Views (full-text article views including HTML views, PDF and ePub downloads, according to the available data) and Abstracts Views on Vision4Press platform.
Data correspond to usage on the plateform after 2015. The current usage metrics is available 48-96 hours after online publication and is updated daily on week days.
Initial download of the metrics may take a while.