Fig. 9
Download original image
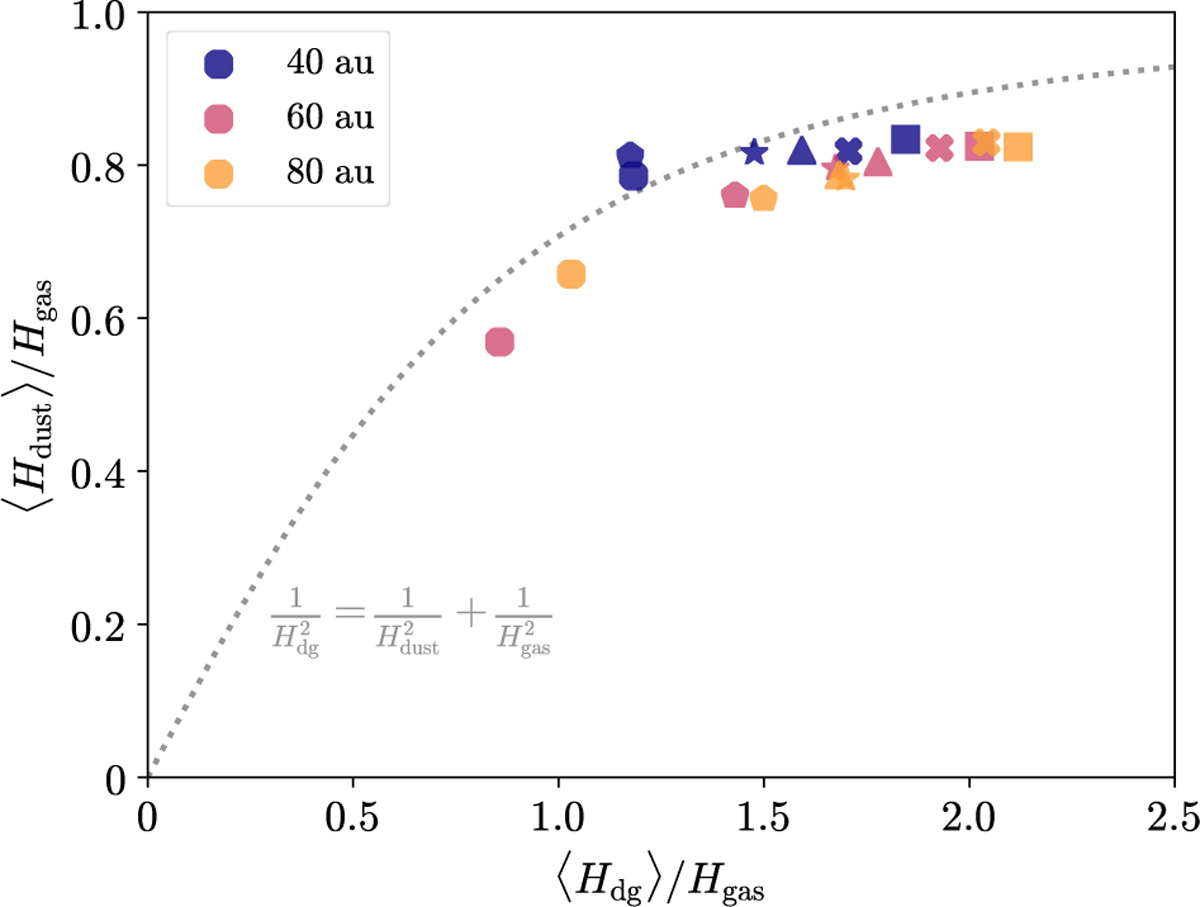
Time-average half-thicknesses of the dust layer, 〈 Hdg〉, vs. time-average dust scale height, 〈 Hdust〉, with different values of R for runs of diffusion cases in the dynamic-dust simulations. The symbols correspond to runs with (ZD2G, a) = (0.003, 10 μm) (circles), (0.01, 10 μm) (triangles), (0.03, 10 μm) (crosses), (0.1, 10 μm) (squares), (0.03, 30 μm) (pentagons), and (0.1, 30 μm) (stars). The dotted line marks the relationship of Hdg and Hdust following Eq. (22).
Current usage metrics show cumulative count of Article Views (full-text article views including HTML views, PDF and ePub downloads, according to the available data) and Abstracts Views on Vision4Press platform.
Data correspond to usage on the plateform after 2015. The current usage metrics is available 48-96 hours after online publication and is updated daily on week days.
Initial download of the metrics may take a while.