Fig. 2
Download original image
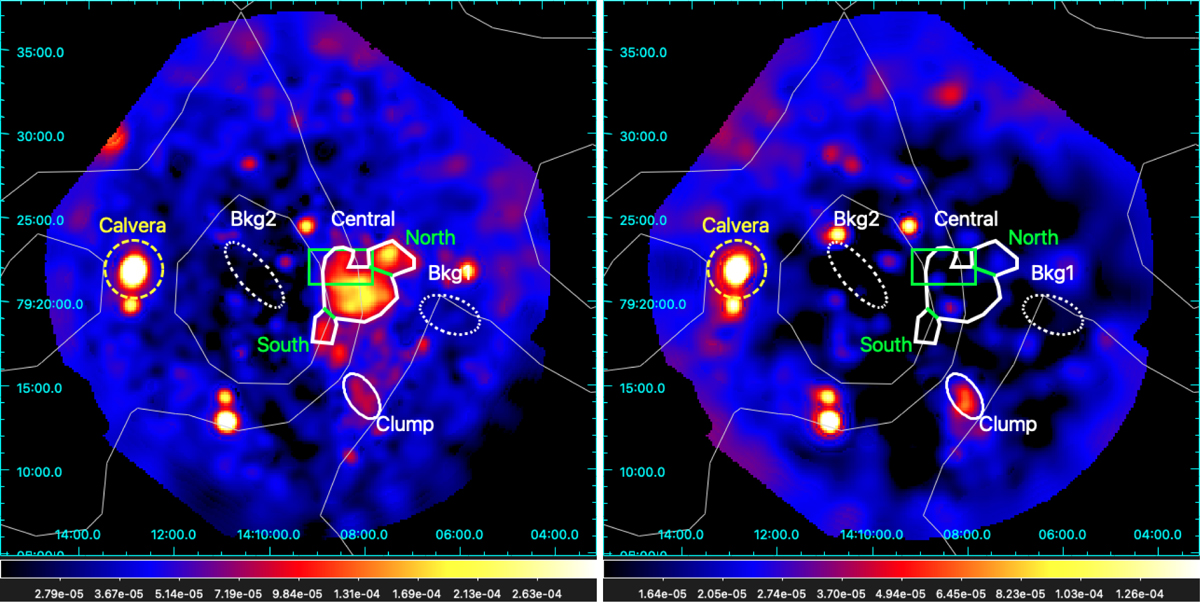
Background-subtracted, vignetting-corrected, and mosaicked count-rate images of Calvera’s SNR in the 0.3–1 keV (left) and 1–2.5 keV (right) energy bands. The area used for the spectral analysis of the brightest diffuse emission (divided into north, central, and south regions) is identified with the white polygon. The white ellipse marks the clump region and the white dashed ellipses are the two regions used for the background. Calvera pulsar is shown with a yellow dashed circle. Fermi/LAT contours from Fig. 1 are overlaid in gray. The green box marks the TNG/DOLORES area of pointing P4 in which the smudge is detected (see Fig. 8).
Current usage metrics show cumulative count of Article Views (full-text article views including HTML views, PDF and ePub downloads, according to the available data) and Abstracts Views on Vision4Press platform.
Data correspond to usage on the plateform after 2015. The current usage metrics is available 48-96 hours after online publication and is updated daily on week days.
Initial download of the metrics may take a while.