Fig. 8
Download original image
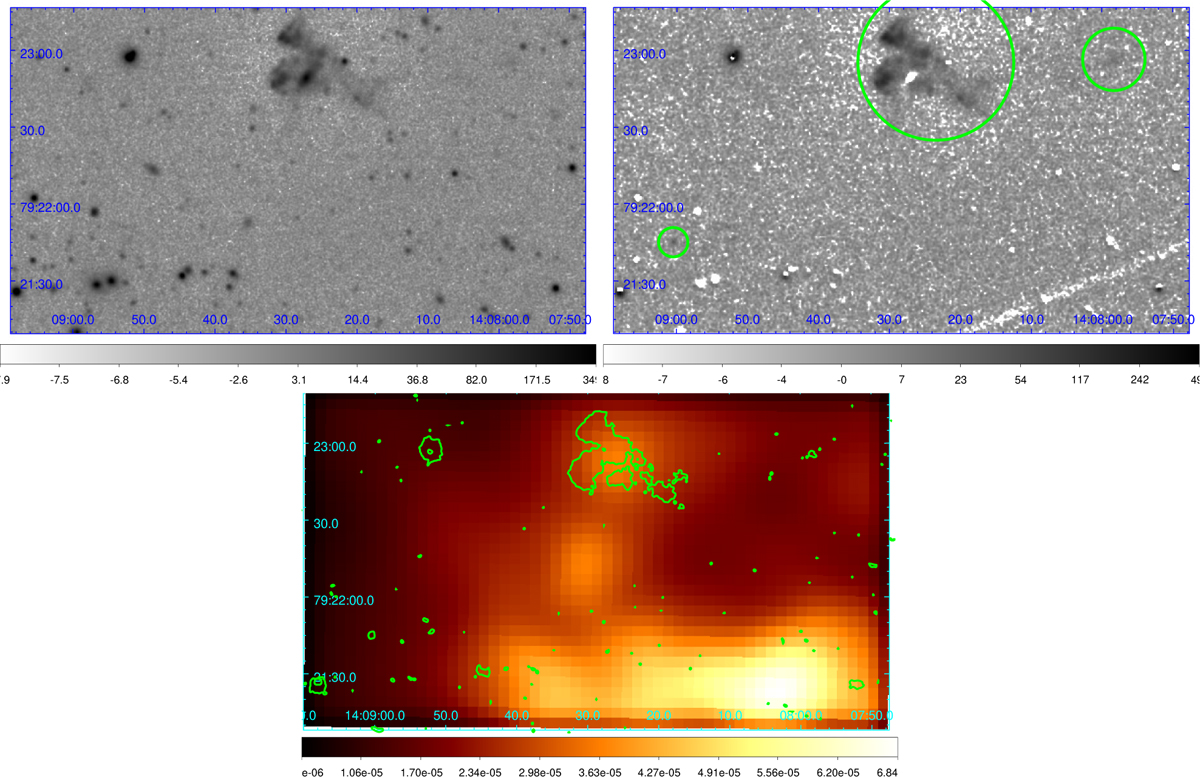
Upper-left panel: TNG/DOLORES deep Hα image of the smudge region originally reported by Arias et al. (2022), corresponding to pointing P4 (see Table 2 and the green box in Fig. 2). The image is background-subtracted and with a logarithmic color scale. Upper right panel: same field as the upper left panel, but with additional continuum subtraction using a re-normalized TNG/DOLORES image in the R-band filter. The large green circle has a radius of 34.5 arcsec and encloses the large and brightest filaments, while the two small circles mark additional faint Hα line emission. Lower panel: X-ray image (same field of view as above) from the left panel of Fig. 2, overlaid with Hα contours at the level of 1.4 × 10⁻¹⁷ erg cm–2 s–1 arcsec–2, showing that the bright optical filament has a weak X-ray counterpart within the central region.
Current usage metrics show cumulative count of Article Views (full-text article views including HTML views, PDF and ePub downloads, according to the available data) and Abstracts Views on Vision4Press platform.
Data correspond to usage on the plateform after 2015. The current usage metrics is available 48-96 hours after online publication and is updated daily on week days.
Initial download of the metrics may take a while.