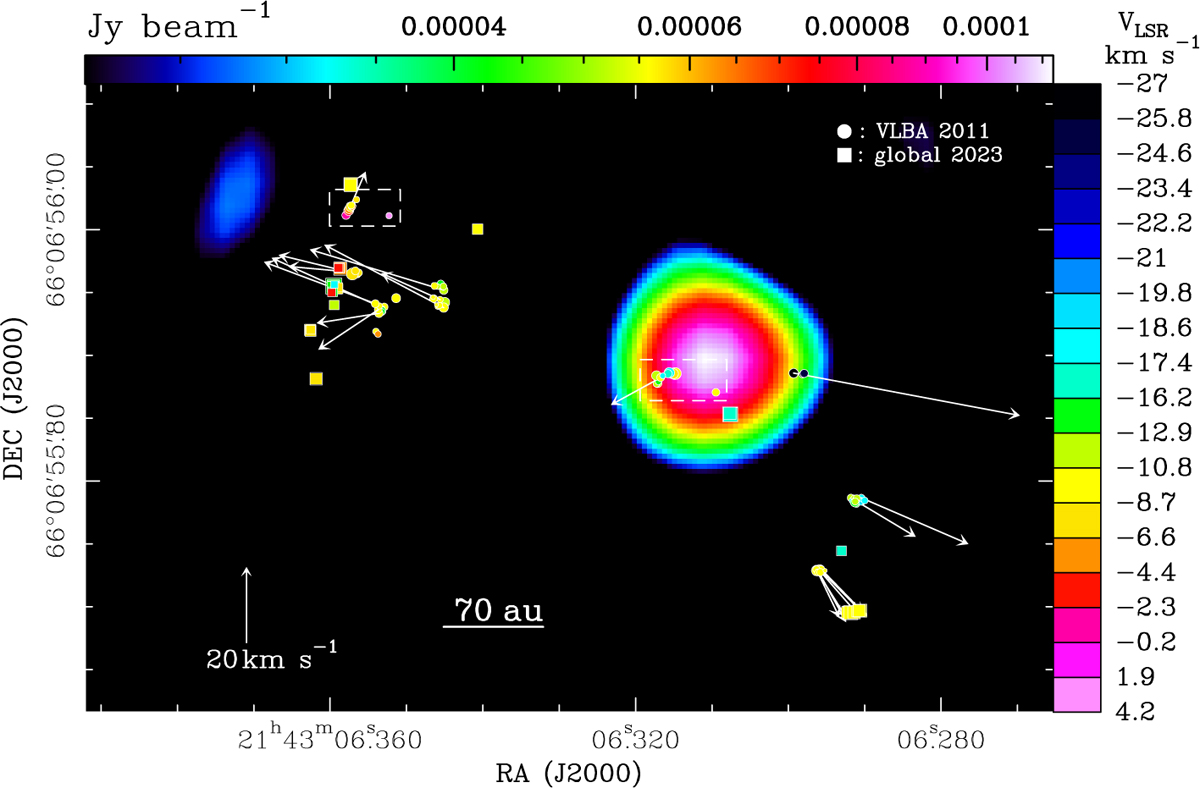
Fig. 2
Download original image
BeSSeL VLBA 2011 and global VLBI 2023 observations of the water masers toward VLA 2. Colored dots and squares have the same meaning as in Fig. 1. White arrows represent the absolute proper motions of the water masers measured through the six VLBA epochs, with the velocity scale shown in the bottom left of the panel. Only the proper motions with directions accurate within 45° are plotted. The two dashed white rectangles encompass the masers that are excluded from the analysis in Sect. 5.1.1 (see text). The color map is the 13 GHz JVLA A-configuration continuum observed within the POETS survey, whose intensity scale is reported in the wedge on top of the panel.
Current usage metrics show cumulative count of Article Views (full-text article views including HTML views, PDF and ePub downloads, according to the available data) and Abstracts Views on Vision4Press platform.
Data correspond to usage on the plateform after 2015. The current usage metrics is available 48-96 hours after online publication and is updated daily on week days.
Initial download of the metrics may take a while.