Fig. 4
Download original image
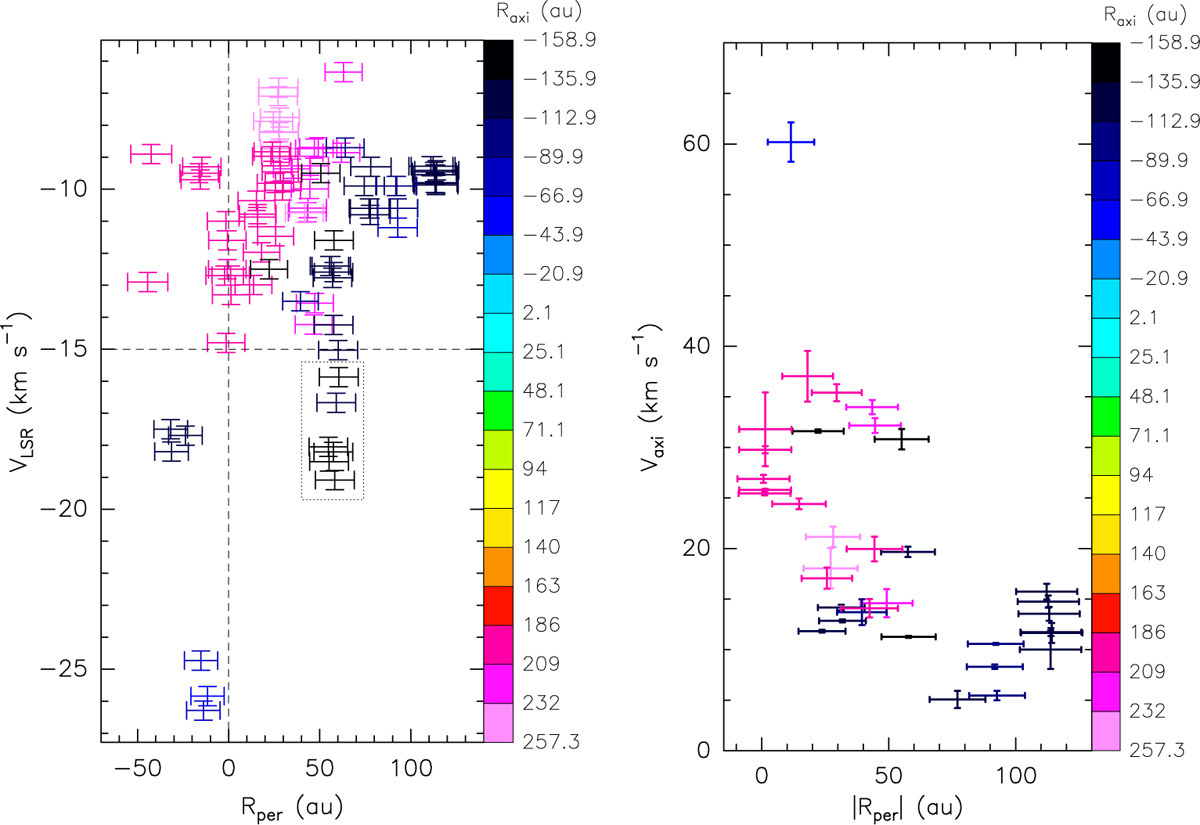
Spatial distribution of the wind velocities. (Left panel) Plot of the maser VLSR versus positions projected perpendicular to the jet axis, Rper (taken positive toward PA = 160°). The colors of the error bars indicate the position projected along the jet axis, Raxi (taken positive toward PA = 70°), as denoted by the wedge to the right of the panel. The two dashed vertical and horizontal lines mark the position and VLSR of the YSO, respectively. The dotted rectangle delimits the water masers with blueshifted VLSR at positive Rper. (Right panel) Plot of the maser velocity component parallel to the jet, Vaxi, versus the absolute value of Rper. Colors have the same meaning as in the left panel.
Current usage metrics show cumulative count of Article Views (full-text article views including HTML views, PDF and ePub downloads, according to the available data) and Abstracts Views on Vision4Press platform.
Data correspond to usage on the plateform after 2015. The current usage metrics is available 48-96 hours after online publication and is updated daily on week days.
Initial download of the metrics may take a while.