Fig. 5
Download original image
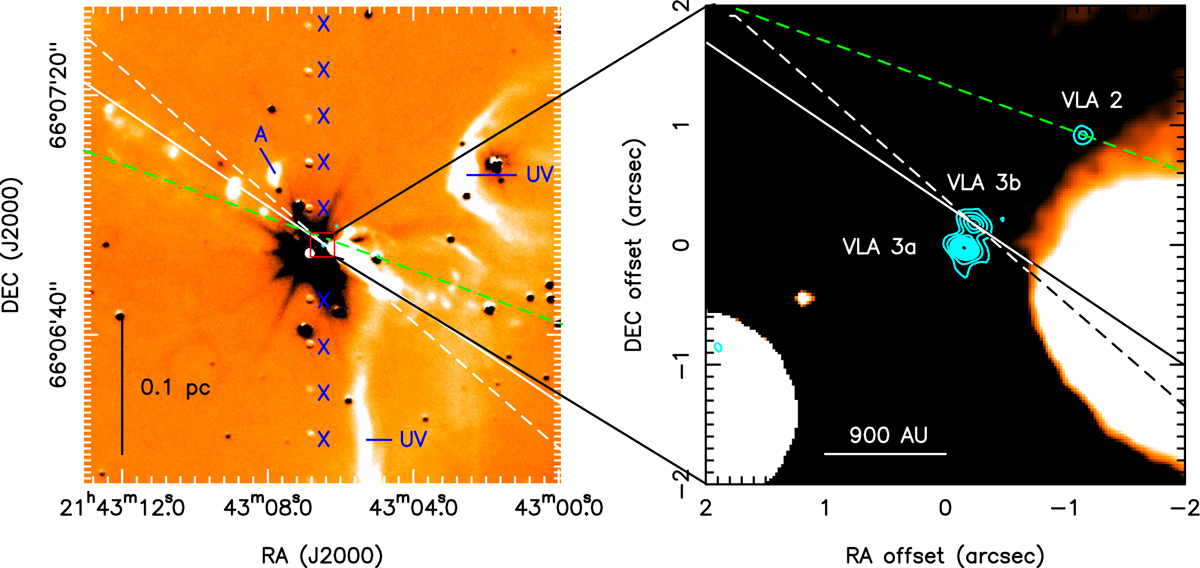
H2 2.12 µm LBT observations toward the G105.42+9.88 (LkHα 234) YSO cluster. (Left panel) Pure H2 line emission (color map) overlaid with the JVLA A-configuration 13 GHz continuum (cyan contours) observed by Moscadelli et al. (2019). The black patches are artifact from the image subtraction due to the fact that the Ks-band filter used to estimate the continuum contribution of the YSO LkHα 234 is centered at a slightly longer wavelength than the H2 narrow-band filter. The emission patches south and northwest of LkHα 234 labeled as “UV” are due to gas excited by the ultra-violet (UV) radiation of a nearby HII region. The blue crosses mark artifacts due to source saturation. The knot labeled “A” corresponds in position with the H2 knot “SP3” studied by Oh et al. (2018, see their Fig. 10). The solid and dashed white lines mark the directions of the elongated radio continuum and water maser proper motions in VLA 3B, respectively, and the dashed green line gives the direction of the water maser jet in VLA 2. (Right panel) Zoom-in on the VLA 3 and VLA 2 radio sources. Plotted contours are 4%, and 10% to 90% (in steps of 10%) of the map peak equal to 0.9 mJy beam−1.
Current usage metrics show cumulative count of Article Views (full-text article views including HTML views, PDF and ePub downloads, according to the available data) and Abstracts Views on Vision4Press platform.
Data correspond to usage on the plateform after 2015. The current usage metrics is available 48-96 hours after online publication and is updated daily on week days.
Initial download of the metrics may take a while.