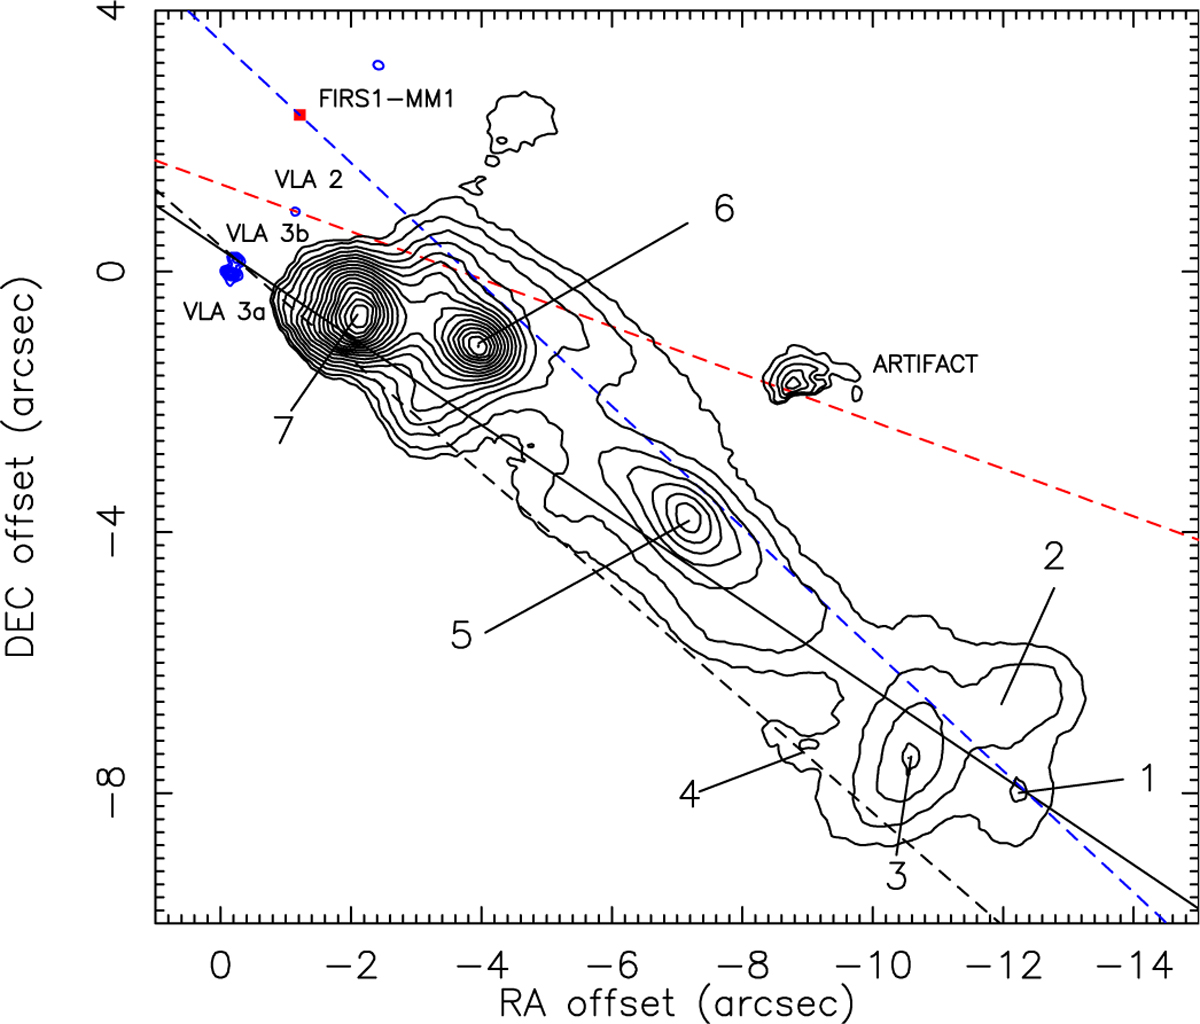
Fig. 6
Download original image
Contour map of pure H2 2.12 µm emission toward G105.42+9.88. The black contours give the H2 line emission reporting the levels at 30σ and from 50σ in steps of 30σ. The blue contours have the same meaning as the cyan contours in Fig. 5. The position of the millimeter source FIRS1-MM1 is indicated by a red square. The solid and dashed black lines mark the directions of the elongated radio continuum and water maser proper motions in VLA 3B, respectively, the dashed red line gives the direction of the water maser jet in VLA 2, and the dashed blue line denotes the direction of the H2 jet from FIRS1-MM1 (Oh et al. 2018). The main H2 knots are labeled after Massi et al. (in preparation).
Current usage metrics show cumulative count of Article Views (full-text article views including HTML views, PDF and ePub downloads, according to the available data) and Abstracts Views on Vision4Press platform.
Data correspond to usage on the plateform after 2015. The current usage metrics is available 48-96 hours after online publication and is updated daily on week days.
Initial download of the metrics may take a while.