Fig. 1.
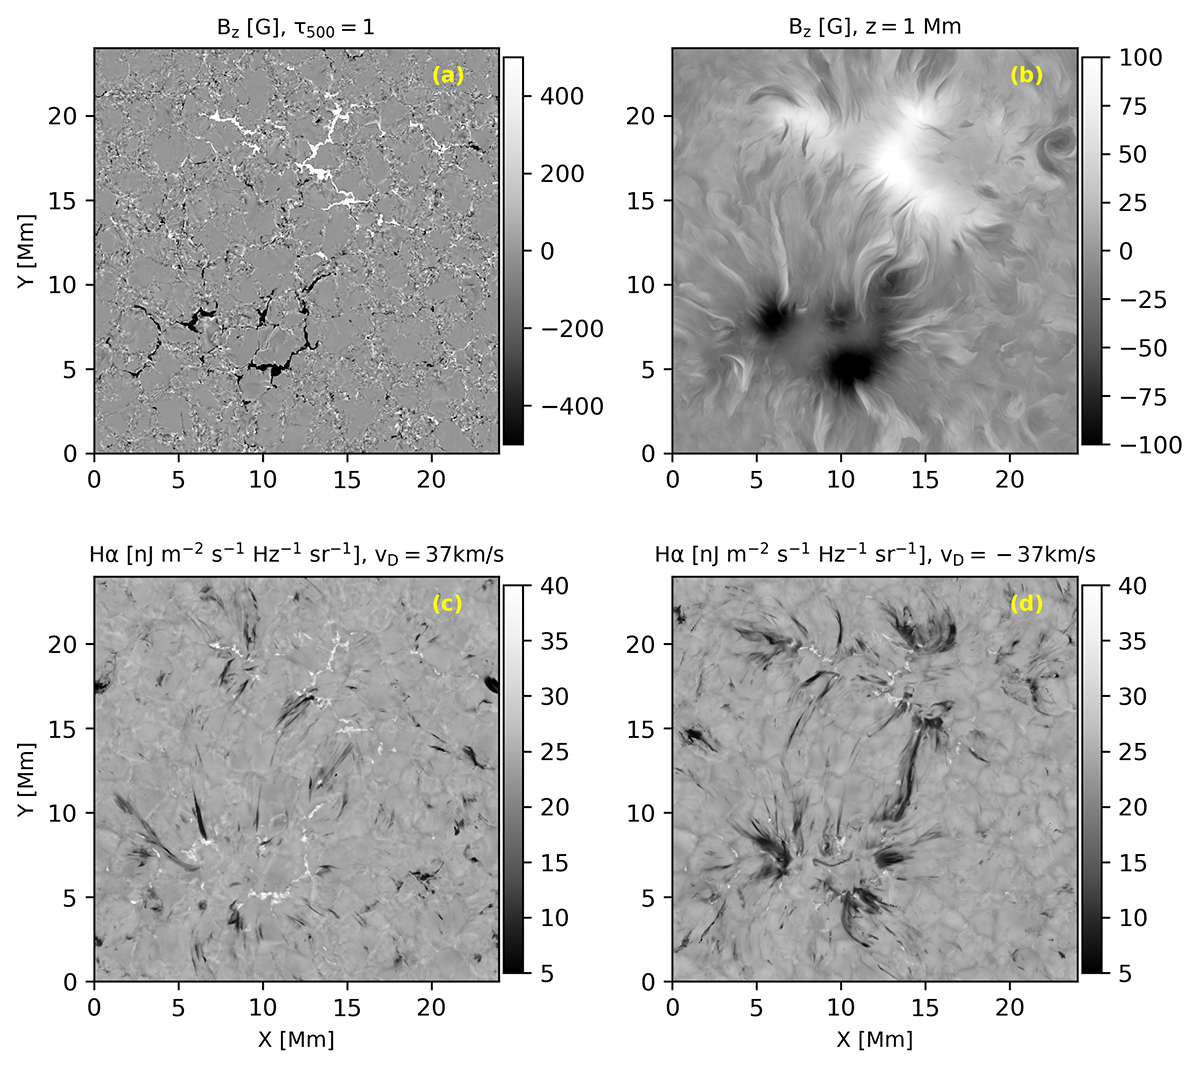
Download original image
Overview of the magnetic field and synthetic Hα intensity in a snapshot of the enhanced network simulation. In panels (a) and (b) we show the vertical component of the magnetic field (Bz) at the surface (τ500 = 1) and in the chromosphere (z = 1 Mm), respectively. Panels (c) and (d) are synthetic Hα intensities in the blue (37 km/s) wing and red (−37 km/s) wing, respectively. vD in the title of panels (c) and (d) denotes the Doppler shift.
Current usage metrics show cumulative count of Article Views (full-text article views including HTML views, PDF and ePub downloads, according to the available data) and Abstracts Views on Vision4Press platform.
Data correspond to usage on the plateform after 2015. The current usage metrics is available 48-96 hours after online publication and is updated daily on week days.
Initial download of the metrics may take a while.