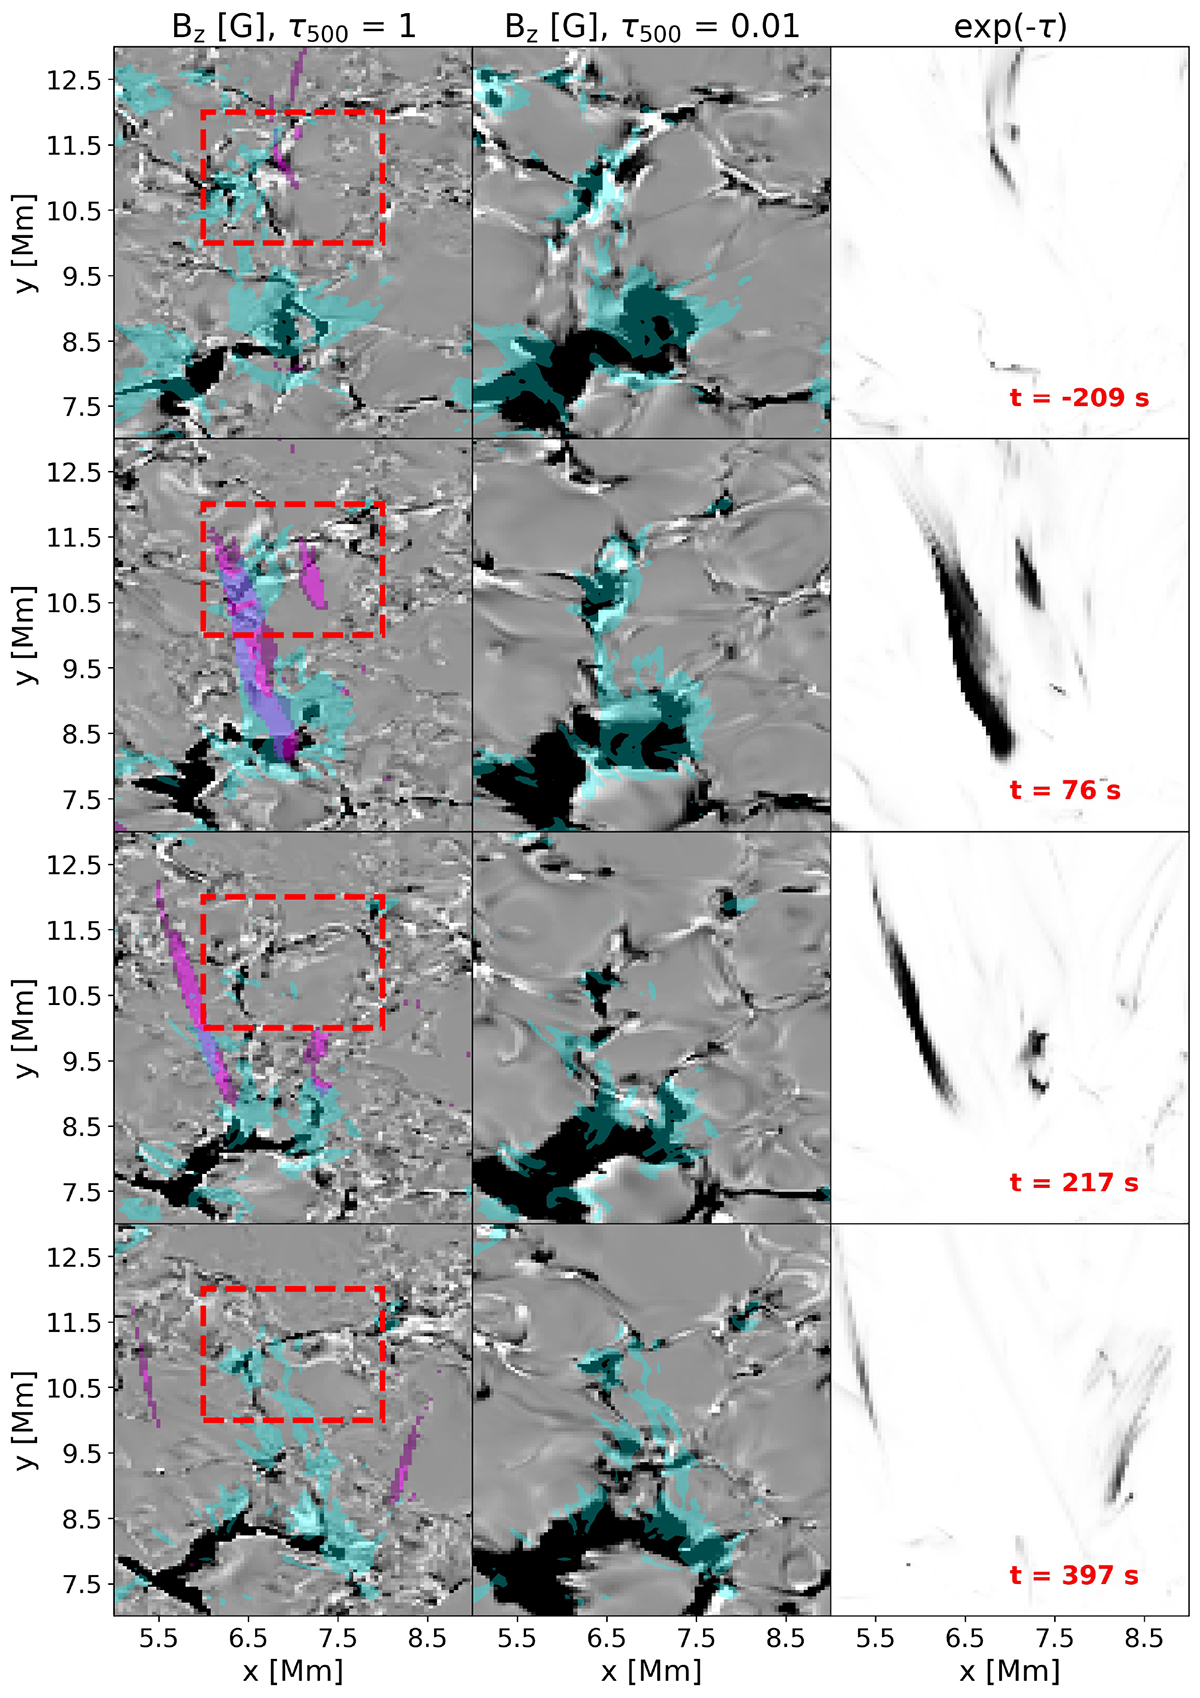
Fig. 10.
Download original image
Zoom-in on the evolution of the line-of-sight magnetic field at various τ levels in the region of the studied feature. Left: Evolution of the vertical component of the magnetic field, Bz at the photosphere (τ500 = 1). The feature from the proxy is overplotted in purple. The dashed red box indicates the region of flux cancellation. Centre: Evolution of Bz in the middle photopshere (τ500 = 0.01). The grey scale for the magnetic field (Bz) ranges from −500 G to 500 G at the τ500 = 1 surface and from −100 G to 100 G at the τ500 = 0.01 surface. The regions of enhanced current density (75% above the mean) are plotted with the cyan contours in both the left and central panels. Right: Zoom-in on the evolution of the feature in the proxy as viewed on disc. A movie spanning the lifetime of the feature is available online.
Current usage metrics show cumulative count of Article Views (full-text article views including HTML views, PDF and ePub downloads, according to the available data) and Abstracts Views on Vision4Press platform.
Data correspond to usage on the plateform after 2015. The current usage metrics is available 48-96 hours after online publication and is updated daily on week days.
Initial download of the metrics may take a while.