Fig. 11.
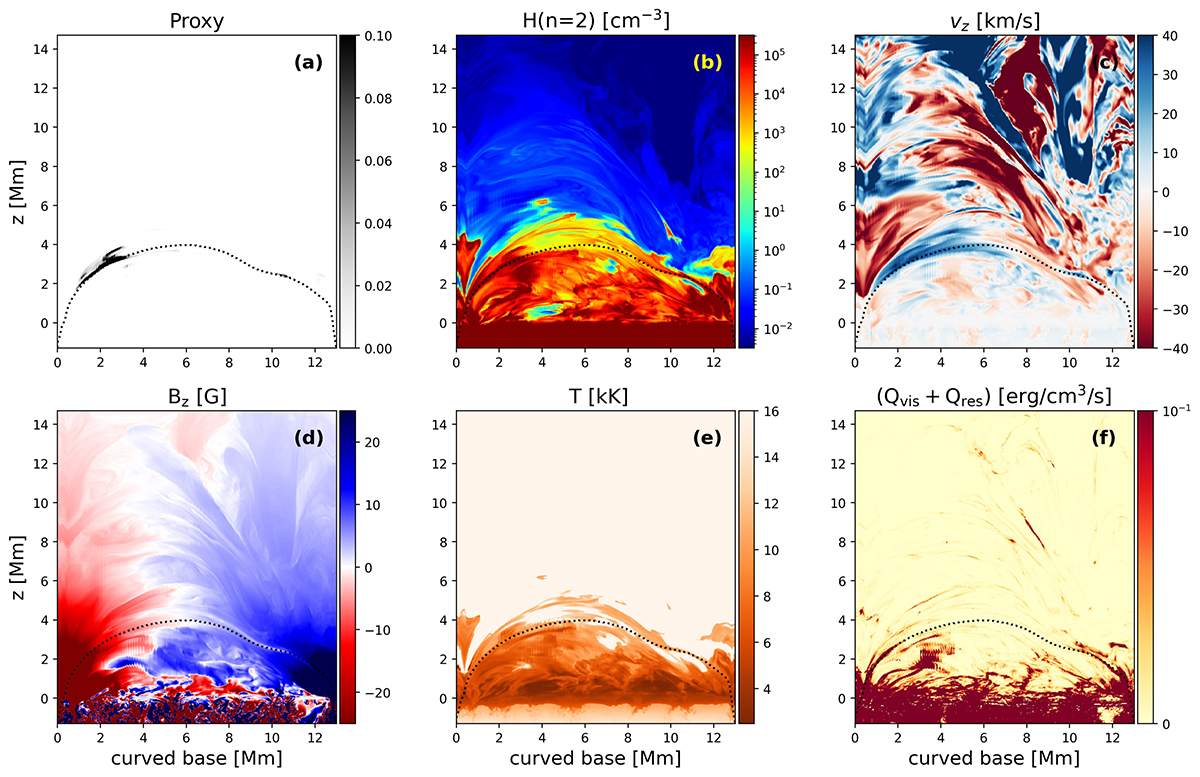
Download original image
Vertical plane passing through the field line containing the feature. The field line is shown by the dotted black line. A vertical plane with a curved base, containing the field line is shown for various quantities. The base of this plane on the τ500 = 1 surface is indicated by the dashed green curve in Fig. 9. Panel (a) shows the proxy (normalised κ) in the vertical plane. Panel (b) is the hydrogen number density at the n = 2 atomic level. Panels (c) and (d) are the vertical velocity and magnetic field components. Panel (e) is the temperature. Panel (f) shows the viscous and resistive heating rate. A time-series for the evolution of this feature and its MHD properties and heating in this plane is available online.
Current usage metrics show cumulative count of Article Views (full-text article views including HTML views, PDF and ePub downloads, according to the available data) and Abstracts Views on Vision4Press platform.
Data correspond to usage on the plateform after 2015. The current usage metrics is available 48-96 hours after online publication and is updated daily on week days.
Initial download of the metrics may take a while.