Fig. 13.
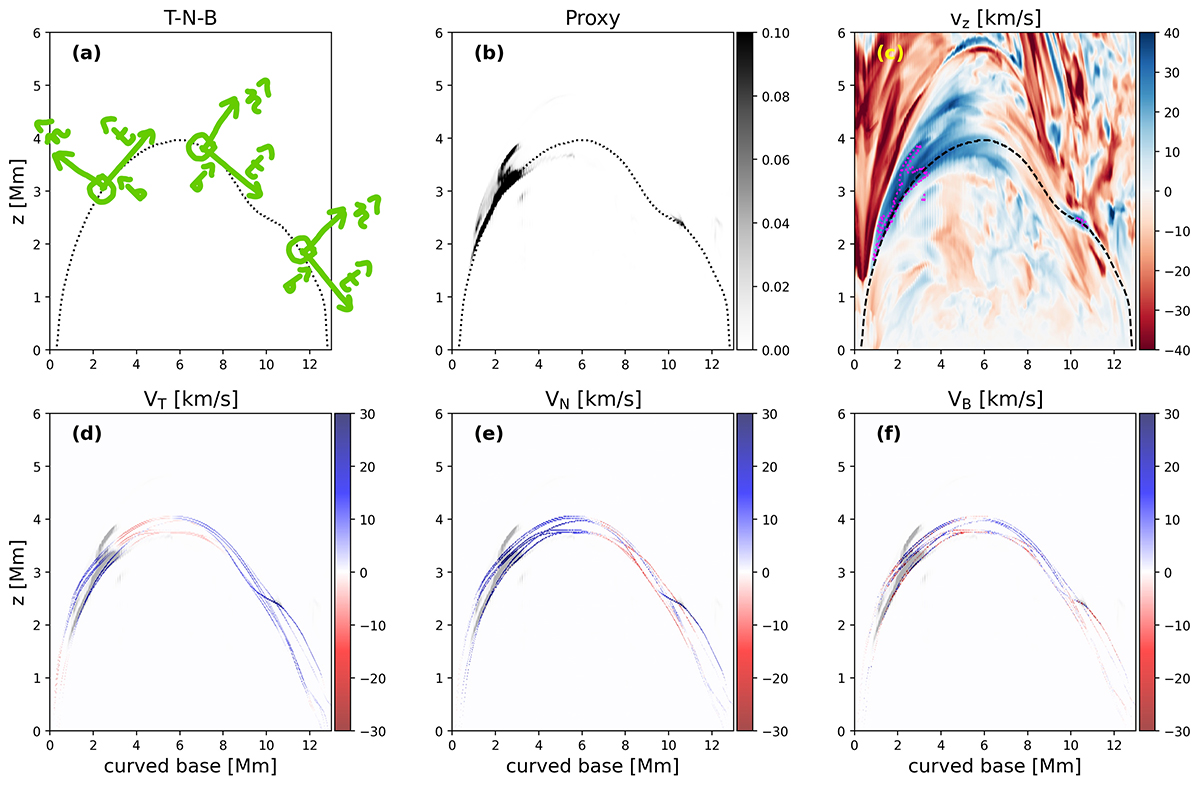
Download original image
The velocity components driving the feature and its visibility. Panel (a) shows the direction of the tangent (T), normal (N) and binormal (B) along the field line for this snapshot. Panel (b) shows the feature on the field line viewed in the proxy. Panel (c) shows the line-of-sight (vertical) velocity and outlines the feature with the magenta contour. Panels (d)-(f) show the flow components along a bunch of field lines traced through the feature.
Current usage metrics show cumulative count of Article Views (full-text article views including HTML views, PDF and ePub downloads, according to the available data) and Abstracts Views on Vision4Press platform.
Data correspond to usage on the plateform after 2015. The current usage metrics is available 48-96 hours after online publication and is updated daily on week days.
Initial download of the metrics may take a while.