Fig. 3.
Download original image
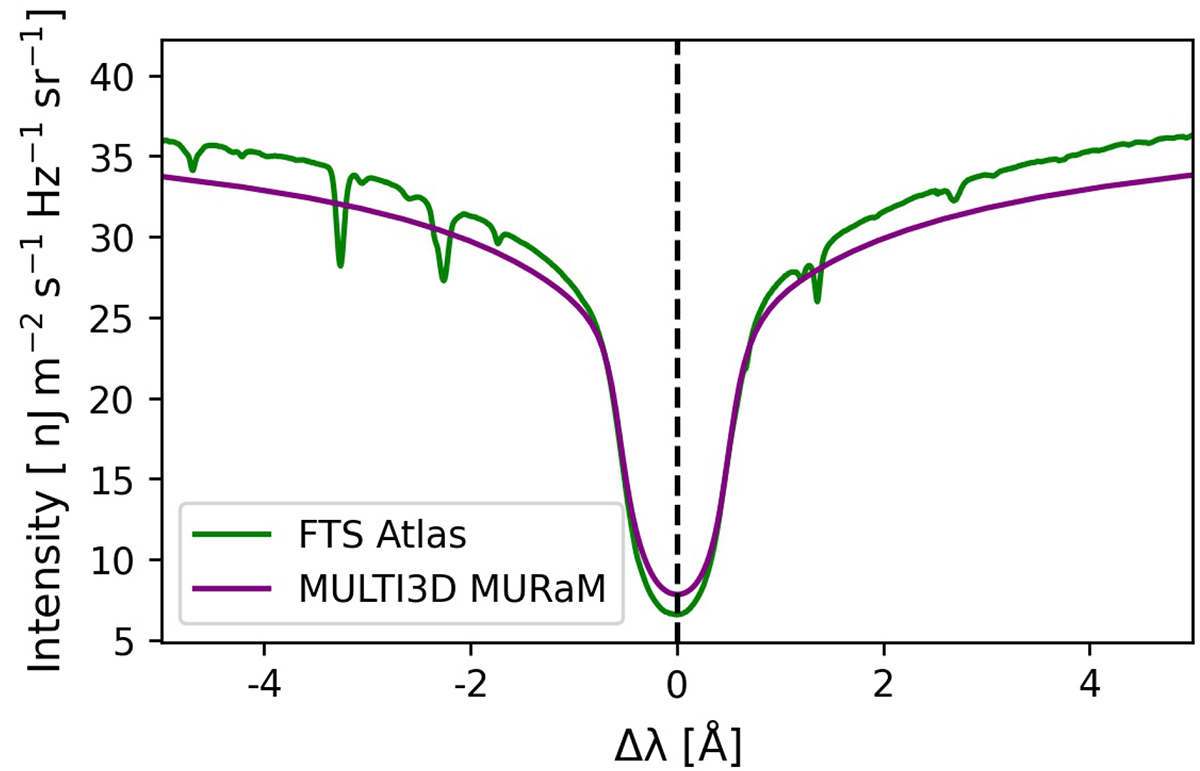
Spatially averaged Hα line profile from the FTS Atlas of Neckel & Labs (1984) (green) compared with the Hα profile synthesised by applying MULTI3D to the simulated MURaM-ChE atmosphere (purple). The dashed black line marks the centre of the line core. We have shifted the synthetic profile (MULTI3D MURaM) by 0.035 Å(≈1.59 km/s) towards the blue wind to align the line cores for comparison.
Current usage metrics show cumulative count of Article Views (full-text article views including HTML views, PDF and ePub downloads, according to the available data) and Abstracts Views on Vision4Press platform.
Data correspond to usage on the plateform after 2015. The current usage metrics is available 48-96 hours after online publication and is updated daily on week days.
Initial download of the metrics may take a while.