Fig. 5.
Download original image
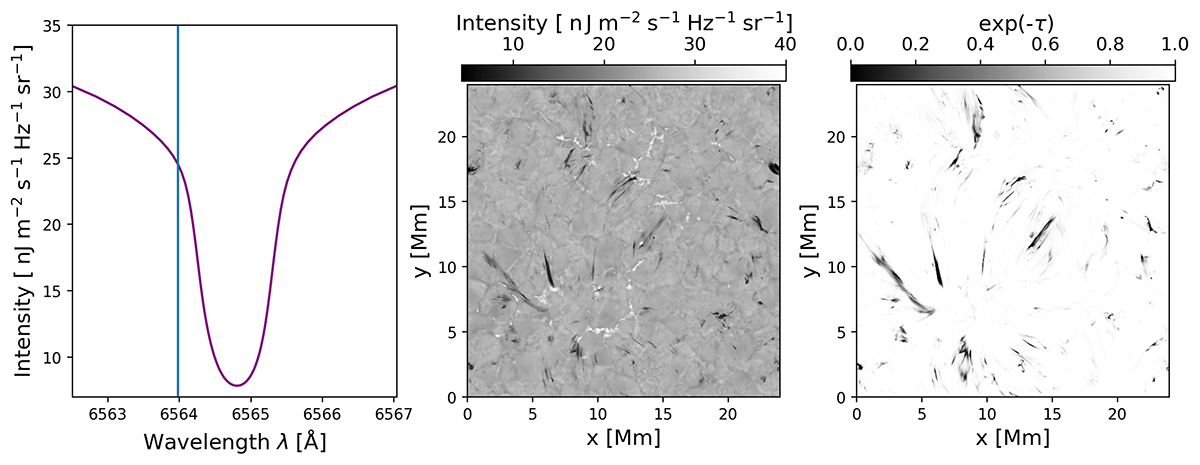
Features in the blue wing at a Doppler velocity of 37 km/s. The leftmost panel shows the average line profile for the synthesised Hα intensity (using MULTI3D) with wavelength. The vertical blue line marks the wavelength at which the Doppler velocity is 37 km/s with respect to the line centre (Δλ = 0). The middle panel shows the synthetic Hα intensity at this wavelength. The third panel shows the proxy at the same wavelength. A scan through the line is available online.
Current usage metrics show cumulative count of Article Views (full-text article views including HTML views, PDF and ePub downloads, according to the available data) and Abstracts Views on Vision4Press platform.
Data correspond to usage on the plateform after 2015. The current usage metrics is available 48-96 hours after online publication and is updated daily on week days.
Initial download of the metrics may take a while.