Fig. 6.
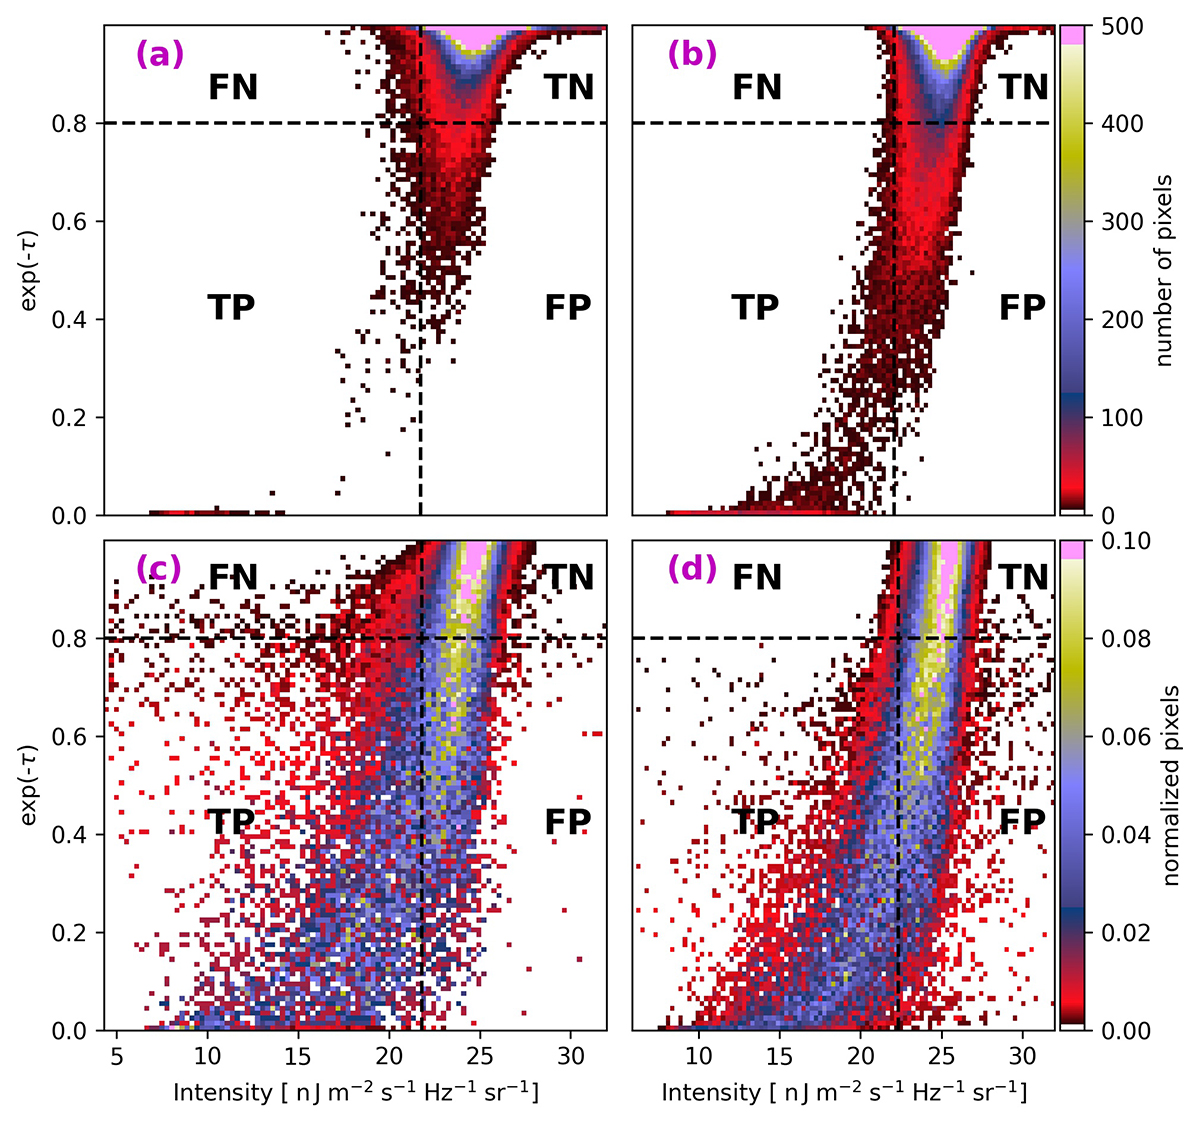
Download original image
2D histogram plots showing the classification of pixels. Panels (a), (b): 2D histograms of the proxy vs. the synthetic Hα intensity at Doppler velocity = 37 km/s (a) and −37 km/s (b). Panels (c), (d): The row normalised distribution of the same pixels corresponding to panels (a) and (b), respectively. We mark the dynamic threshold for the synthetic intensity with vertical dashed black lines. The static threshold for the proxy for feature identification is marked by the horizontal dashed black lines. The four pixel categories: true positive (TP), true negative (TN), false positive (FP), and false negative (FN) are also indicated on each of the panels.
Current usage metrics show cumulative count of Article Views (full-text article views including HTML views, PDF and ePub downloads, according to the available data) and Abstracts Views on Vision4Press platform.
Data correspond to usage on the plateform after 2015. The current usage metrics is available 48-96 hours after online publication and is updated daily on week days.
Initial download of the metrics may take a while.