Fig. 7.
Download original image
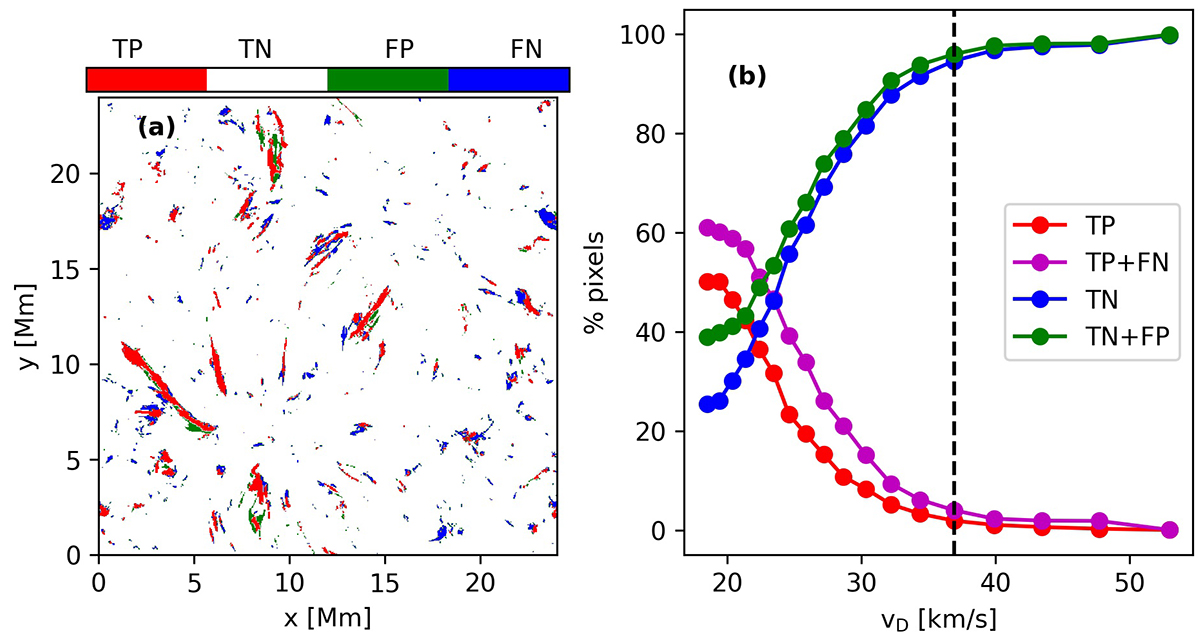
Goodness of the proxy at Doppler velocity = 37 km/s. Panel (a) gives a spatial distribution of (in)correctly identified pixels. The pixels are colour-coded to show true positives (TPs: red), true negatives (TNs: white), false positives (FPs: green) and false negatives (FNs: blue). Panel (b) represents the percentage of (in)correctly identified pixels as a function of the Doppler velocity (vD) in the blue wing of the line. The dashed black line marks the position in the line wing (vD = 37 km/s) at which panel (a) is obtained. A scan through the blue wing of the line exhibiting the goodness of the proxy is available online.
Current usage metrics show cumulative count of Article Views (full-text article views including HTML views, PDF and ePub downloads, according to the available data) and Abstracts Views on Vision4Press platform.
Data correspond to usage on the plateform after 2015. The current usage metrics is available 48-96 hours after online publication and is updated daily on week days.
Initial download of the metrics may take a while.