Fig. 8.
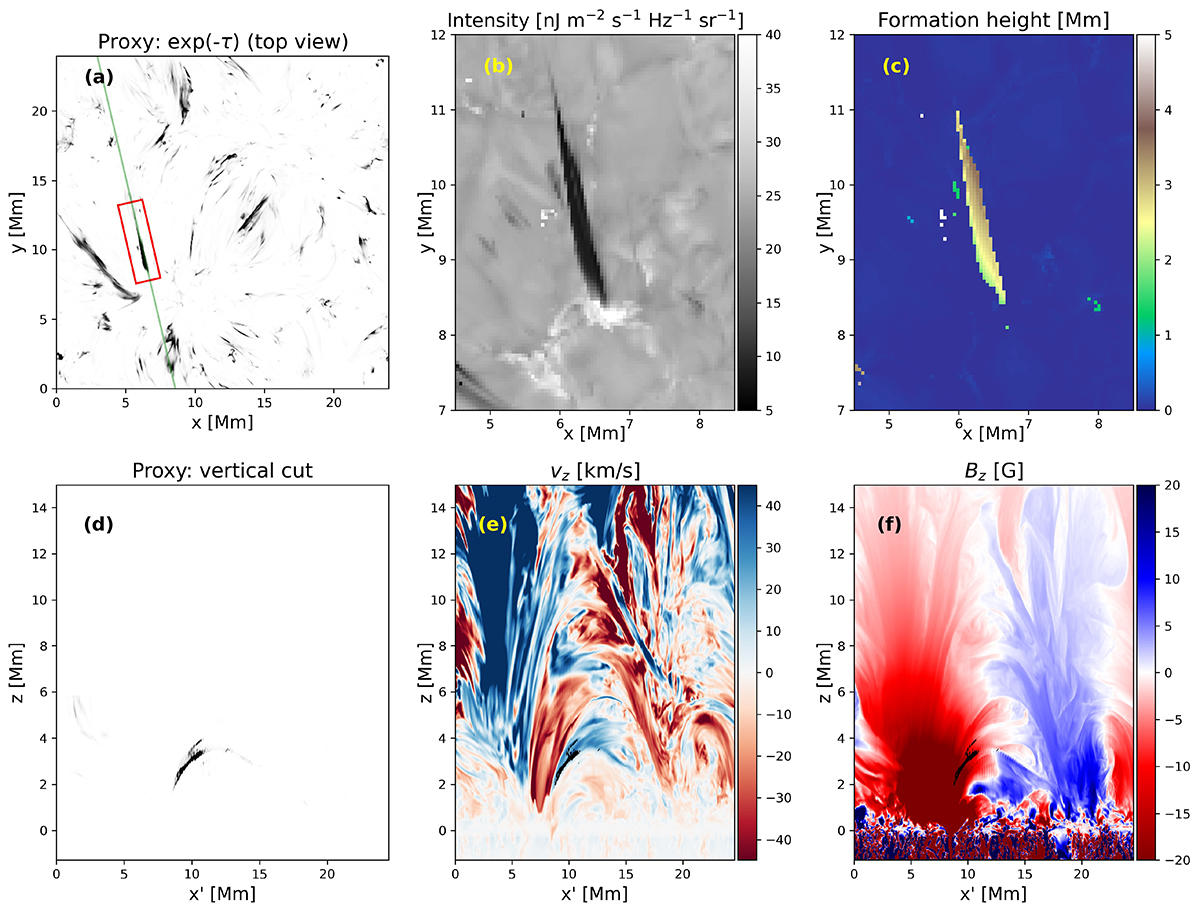
Download original image
Overview of one blueshifted feature (vD = 37 km/s) detected by the proxy. Panel (a) shows the proxy map with the feature of interest highlighted by the red box. The green line passing through the feature marks the base for the vertical cut through the feature (hereby x′ axis). The 0 of x′ corresponds to (x, y) = (8.6, 0) Mm in the top view (in panel a). Panels (b) and (c) are a zoomed-in view of the feature showing the synthetic intensity in Hα and formation height, respectively (obtained with the MULTI3D synthesis). In panel (d) we take a vertical cut through the feature in the proxy (normalised κ). Panels (e) and (f) show the same vertical cut for the line-of-sight (i.e. vertical) component of the velocity and magnetic field, respectively, with the feature over-plotted in black. A time-lapse of the proxy map in the top view and vertical cuts of various MHD quantities is available online.
Current usage metrics show cumulative count of Article Views (full-text article views including HTML views, PDF and ePub downloads, according to the available data) and Abstracts Views on Vision4Press platform.
Data correspond to usage on the plateform after 2015. The current usage metrics is available 48-96 hours after online publication and is updated daily on week days.
Initial download of the metrics may take a while.