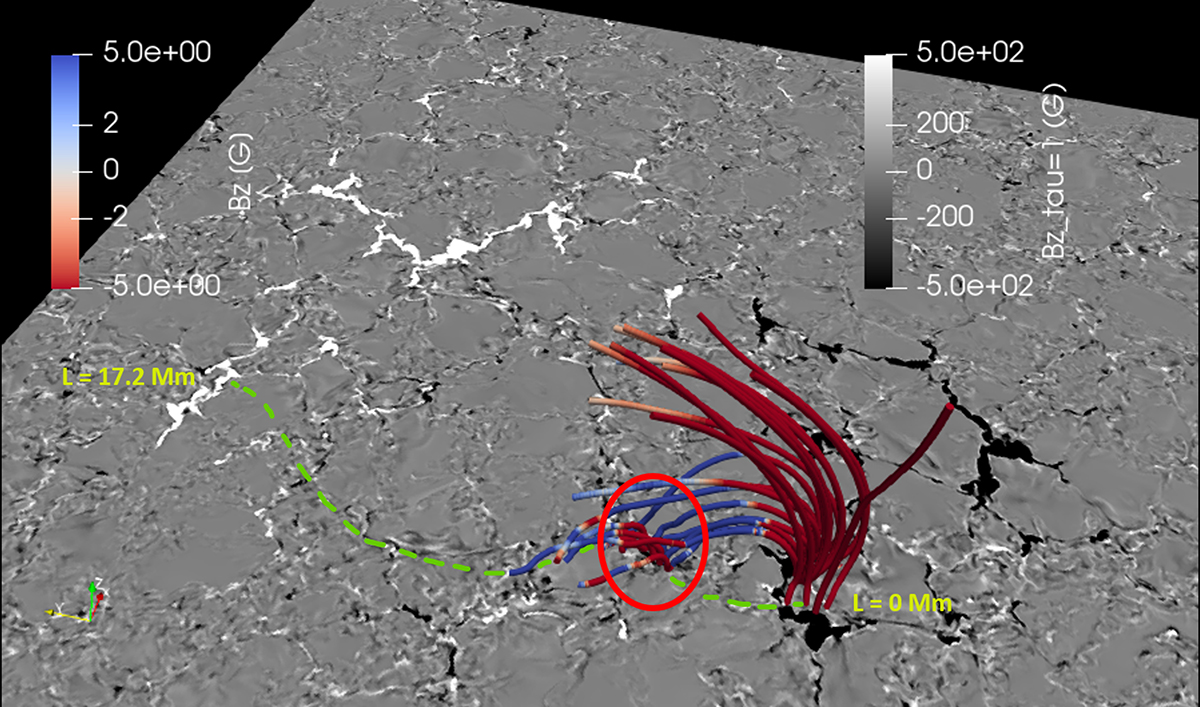
Fig. 9.
Download original image
3D rendering of magnetic field lines rooted at the footpoint of the feature at t = 0 s, the first appearance of the feature. The line-of-sight component of the magnetic field is shown as a surface map at the τ500 = 1 surface. The 3D field lines are coloured by the vertical (Bz) component. The site of magnetic reconnection lies across the main footpoint and is marked by the red circle. The dashed green line shows the xy projection of the 3D field line carrying the feature in this snapshot. The magnetic field lines are clipped for better visualisation. A time-series showing the rearrangement of magnetic field lines at the time of feature formation is available online.
Current usage metrics show cumulative count of Article Views (full-text article views including HTML views, PDF and ePub downloads, according to the available data) and Abstracts Views on Vision4Press platform.
Data correspond to usage on the plateform after 2015. The current usage metrics is available 48-96 hours after online publication and is updated daily on week days.
Initial download of the metrics may take a while.