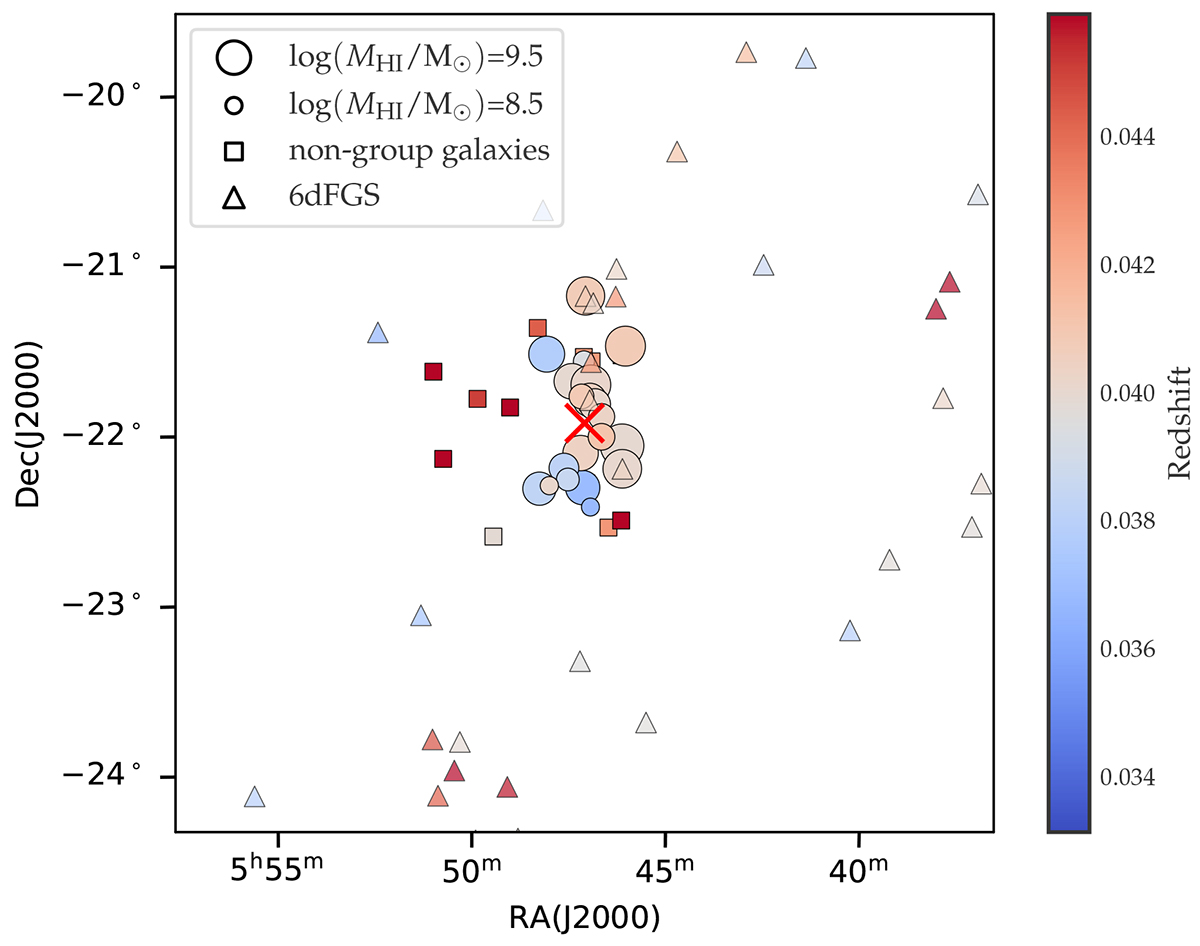
Fig. 1.
Download original image
Spatial distribution scatter plot in RA and Dec of all galaxies in the final SOFIA 2 catalogue. Circular markers have been linked by a friends-of-friends algorithm described in Sect. 3.2. Square markers indicate isolated galaxies or group galaxies belonging to groups with fewer members than the primary group. The size of the circular markers is scaled by H I mass with two indicative masses displayed in the legend. The red cross represents the geometric mean coordinates of the orange points. Galaxies from 6dFGS with spectroscopic redshifts are shown with triangles. All markers are colourised by redshift.
Current usage metrics show cumulative count of Article Views (full-text article views including HTML views, PDF and ePub downloads, according to the available data) and Abstracts Views on Vision4Press platform.
Data correspond to usage on the plateform after 2015. The current usage metrics is available 48-96 hours after online publication and is updated daily on week days.
Initial download of the metrics may take a while.