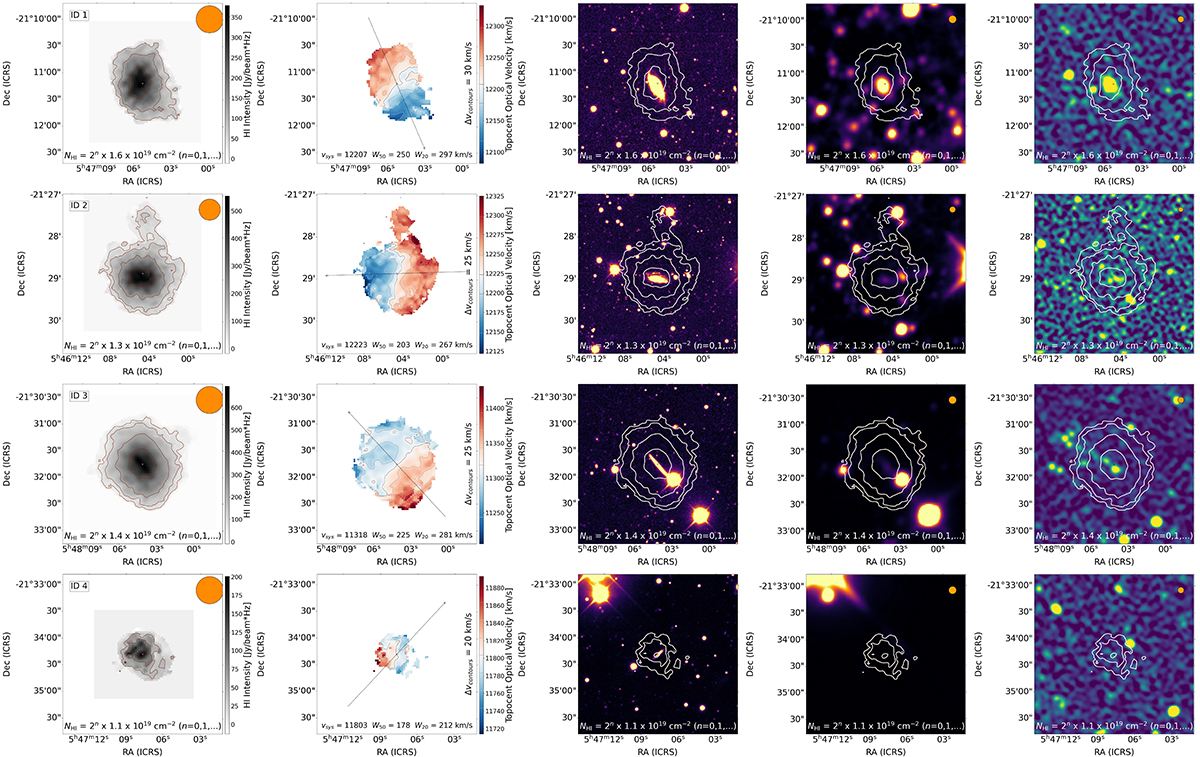
Fig. 3.
Download original image
From left to right (for IDs 1-4), moment 0 (integrated H I) map, moment 1 (velocity field), DES g-band, WISE W1 band, MeerKAT L-band continuum. In the moment 1 map, we show the recessional velocity of the source (vsys), spectral line width at 50% and 20% of the peak flux density (W50 and W20), as well as the velocity difference between contours (Δvcontours). An indication of the kinematic position angle is given by the line centred on the flux-weighted centroid of the source. In the other images, we show contours from the moment 0 map overlaid at H I column densities indicated at the bottom of the images. The moment 0 map has the H I restoring beam (30.65″ × 30.65″) displayed in the top-right corner. Similarly, we show the MeerKAT continuum map restoring beam (6.87″ × 6.87″). The DES g-band and WISE W1 band have a point spread function full width half maximum of 1.11″ and 6.1″, respectively, also shown in the top right.
Current usage metrics show cumulative count of Article Views (full-text article views including HTML views, PDF and ePub downloads, according to the available data) and Abstracts Views on Vision4Press platform.
Data correspond to usage on the plateform after 2015. The current usage metrics is available 48-96 hours after online publication and is updated daily on week days.
Initial download of the metrics may take a while.