Fig. 5.
Download original image
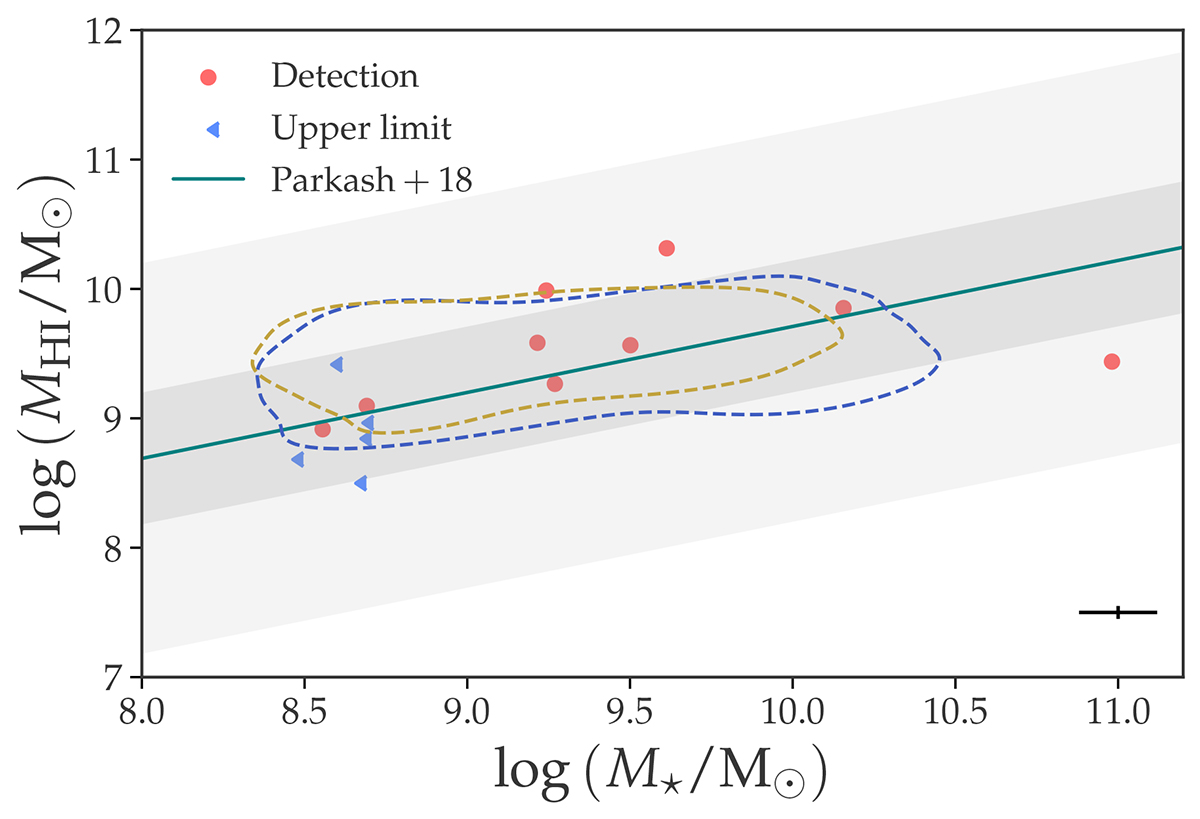
Relation of MHI–M* from Parkash et al. (2018) in teal. The 1σ and 3σ confidence intervals are shown with the shaded areas. Sources from this work are shown in coral (detections) and blue (upper limits). An indicative error is given in the bottom right as 0.12 dex on the stellar mass (based on the scatter of the relation (Jarrett et al. 2023)) and 0.05 dex on the H I mass (based on the uncertainty outlined in Section 3.3). The blue (yellow) dashed contours enclose 68% of the SIMBA analogue (field) galaxies (see Sect. 4.5.4).
Current usage metrics show cumulative count of Article Views (full-text article views including HTML views, PDF and ePub downloads, according to the available data) and Abstracts Views on Vision4Press platform.
Data correspond to usage on the plateform after 2015. The current usage metrics is available 48-96 hours after online publication and is updated daily on week days.
Initial download of the metrics may take a while.