Fig. 7.
Download original image
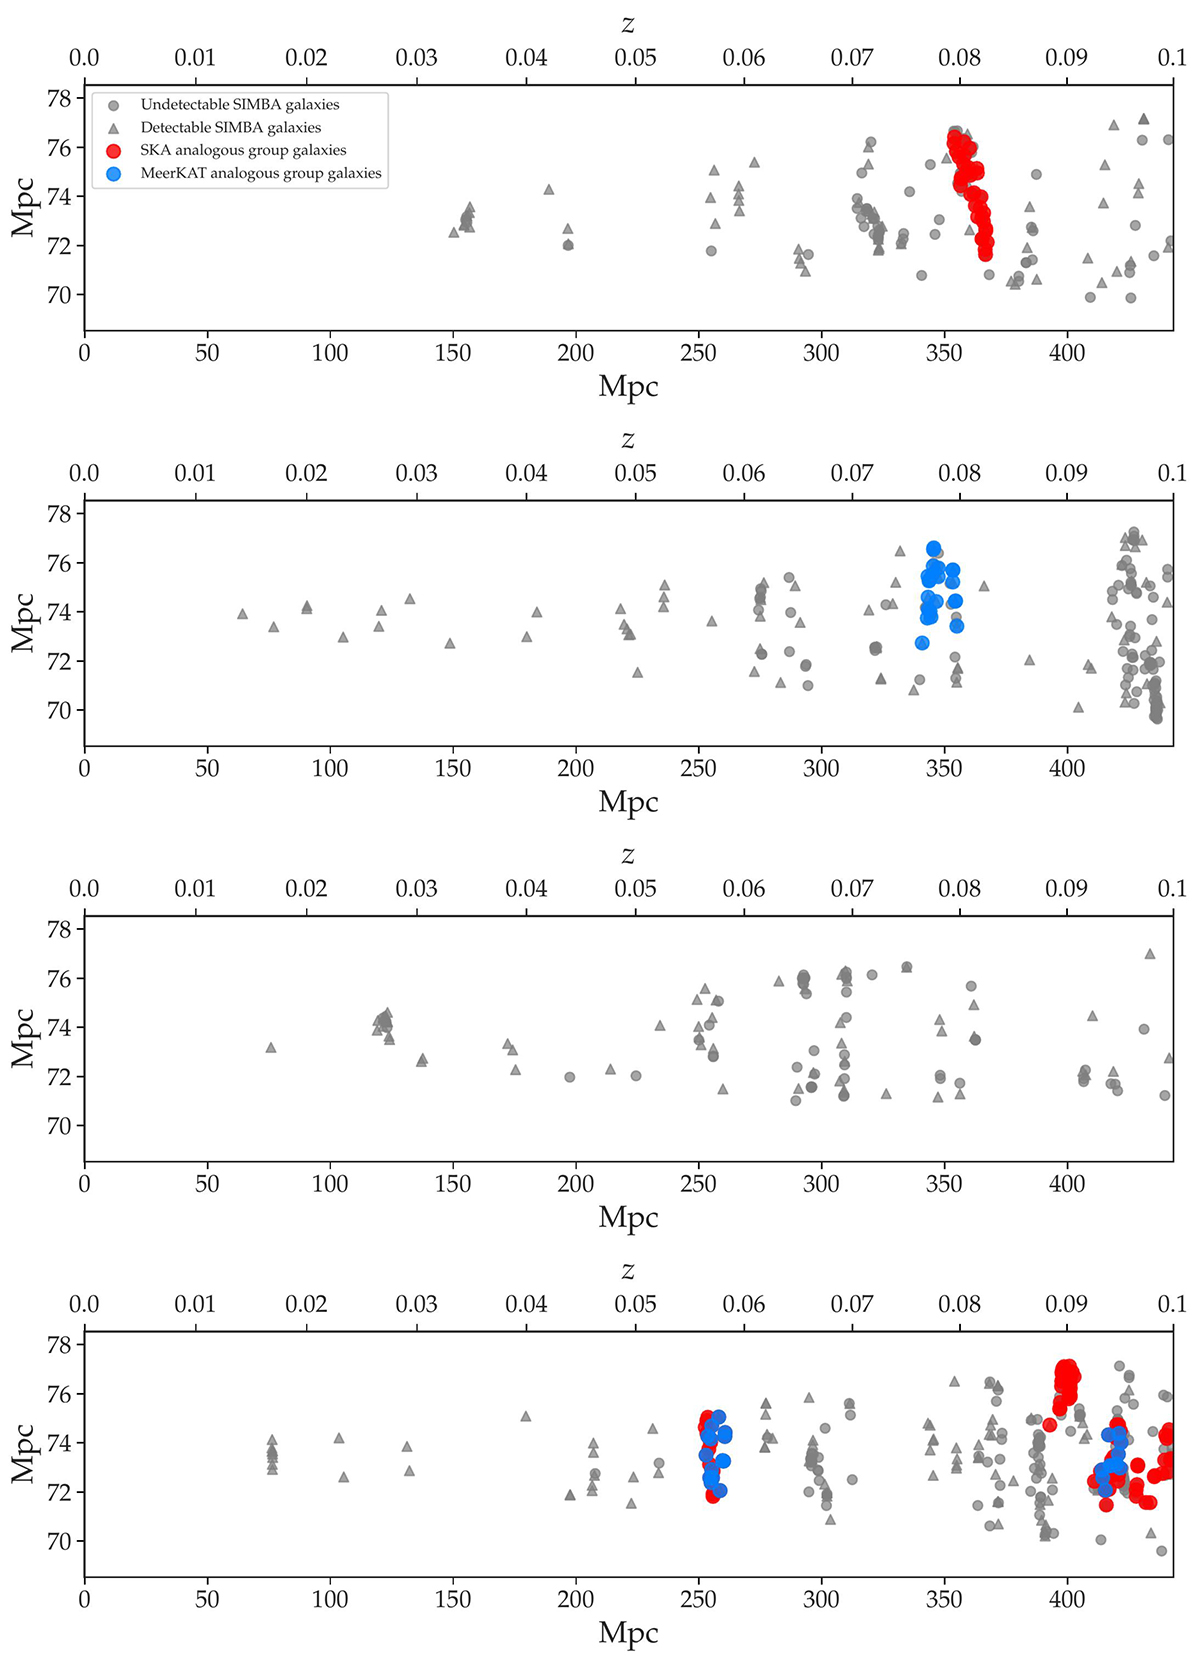
Depiction of example light cones generated with SIMBA. The bottom x-axis and the y-axis refer to the cosmological co-moving distance. The top x-axis shows the corresponding redshift. Blue points are galaxies that would be detectable with a MeerKAT observation analogous to the one in this work. Red points show galaxies that would be above the detection threshold given a similar observation with the addition of 80 SKA-mid dishes. Grey circles show galaxies that do not form part of either MeerKAT or SKA-mid detectable structures, given an observation with equal integration time. Grey triangles show galaxies that are individually detectable by MeerKAT, but do not belong to a detectable analogues structure.
Current usage metrics show cumulative count of Article Views (full-text article views including HTML views, PDF and ePub downloads, according to the available data) and Abstracts Views on Vision4Press platform.
Data correspond to usage on the plateform after 2015. The current usage metrics is available 48-96 hours after online publication and is updated daily on week days.
Initial download of the metrics may take a while.